Fission product yield
| Prop: Unit: | t½ (Ma) | Yield (%) | Q * (keV) | βγ * |
|---|---|---|---|---|
99Tc | 0.211 | 6.1385 | 294 | β |
126Sn | 0.230 | 0.1084 | 4050 | βγ |
79Se | 0.327 | 0.0447 | 151 | β |
93Zr | 1.53 | 5.4575 | 91 | βγ |
135Cs | 2.3 | 6.9110 | 269 | β |
107Pd | 6.5 | 1.2499 | 33 | β |
129I | 15.7 | 0.8410 | 194 | βγ |
| Hover underlined: more info | ||||
| Prop: Unit: | t½ (a) | Yield (%) | Q * (keV) | βγ * |
|---|---|---|---|---|
155Eu | 4.76 | 0.0803 | 252 | βγ |
85Kr | 10.76 | 0.2180 | 687 | βγ |
113mCd | 14.1 | 0.0008 | 316 | β |
90Sr | 28.9 | 4.505 | 2826 | β |
137Cs | 30.23 | 6.337 | 1176 | βγ |
121mSn | 43.9 | 0.00005 | 390 | βγ |
151Sm | 88.8 | 0.5314 | 77 | β |
Nuclear fission splits a heavy nucleus such as uranium or plutonium into two lighter nuclei, which are called fission products. Yield refers to the fraction of a fission product produced per fission.
Yield can be broken down by:
- Individual isotope
Chemical element spanning several isotopes of different mass number but same atomic number.- Nuclei of a given mass number regardless of atomic number. Known as "chain yield" because it represents a decay chain of beta decay.
Isotope and element yields will change as the fission products undergo beta decay, while chain yields do not change after completion of neutron emission by a few neutron-rich initial fission products (delayed neutrons), with halflife measured in seconds.
A few isotopes can be produced directly by fission, but not by beta decay because the would-be precursor with atomic number one greater is stable and does not decay. Chain yields do not account for these "shadowed" isotopes; however, they have very low yields (less than a millionth as much as common fission products) because they are far less neutron-rich than the original heavy nuclei.
Yield is usually stated as percentage per fission, so that the total yield percentages sum to 200%. Less often, it is stated as percentage of all fission products, so that the percentages sum to 100%.
Ternary fission, about 0.2% to 0.4% of fissions, also produces a third light nucleus such as helium-4 (90%) or tritium (7%).
Contents
1 Mass vs. yield curve
2 Ordered by yield (thermal neutron fission of U-235)
3 Cumulative Fission Yields
4 Ordered by mass number (thermal fission)
5 Half lives, decay modes, and branching fractions
6 Ordered by thermal neutron neutron absorption cross section
7 References
8 External links
Mass vs. yield curve

Fission product yields by mass for thermal neutron fission of U-235, Pu-239, a combination of the two typical of current nuclear power reactors, and U-233 used in the thorium cycle
If a graph of the mass or mole yield of fission products against the atomic number of the fragments is drawn then it has two peaks, one in the area zirconium through to palladium and one at xenon through to neodymium. This is because the fission event causes the nucleus to split in an asymmetric manner,[1] as nuclei closer to magic numbers are more stable.[2]
Yield vs. Z - This is a typical distribution for the fission of uranium. Note that in the calculations used to make this graph the activation of fission products was ignored and the fission was assumed to occur in a single moment rather than a length of time. In this bar chart results are shown for different cooling times (time after fission).
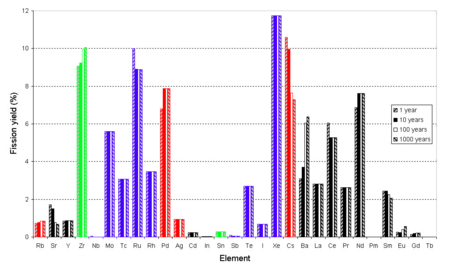
Yield vs Z. Colors indicate fluoride volatility, which is important in nuclear reprocessing: Blue elements have volatile fluorides or are already volatile; green elements do not but have volatile chlorides; red elements have neither, but the elements themselves are volatile at very high temperatures. Yields at 100,1,2,3 years after fission, not considering later neutron capture, fraction of 100% not 200%. Beta decay Kr-85→Rb, Sr-90→Zr, Ru-106→Pd, Sb-125→Te, Cs-137→Ba, Ce-144→Nd, Sm-151→Eu, Eu-155→Gd visible.
Because of the stability of nuclei with even numbers of protons and/or neutrons the curve of yield against element is not a smooth curve. It tends to alternate.
In general, the higher the energy of the state that undergoes nuclear fission, the more likely a symmetric fission is, hence as the neutron energy increases and/or the energy of the fissile atom increases, the valley between the two peaks becomes more shallow; for instance, the curve of yield against mass for Pu-239 has a more shallow valley than that observed for U-235, when the neutrons are thermal neutrons. The curves for the fission of the later actinides tend to make even more shallow valleys. In extreme cases such as 259Fm, only one peak is seen.
Yield is usually expressed relative to number of fissioning nuclei, not the number of fission product nuclei, that is, yields should sum to 200%.
The table in the next section ("Ordered by yield") gives yields for notable radioactive (with halflife greater than one year, plus iodine-131) fission products, and (the few most absorptive) neutron poison fission products, from thermal neutron fission of U-235 (typical of nuclear power reactors), computed from [1].
The yields in the table sum to only 45.5522%, including 34.8401% which have halflife greater than one year:
| t½ in years | yield |
|---|---|
| 1 to 5 | 2.7252% |
| 10 to 100 | 12.5340% |
| 2 to 300,000 | 6.1251% |
| 1.5 to 16 million | 13.4494% |
The remainder and the unlisted 54.4478% decay with halflife less than one year into nonradioactive nuclei.
This is before accounting for the effects of any subsequent neutron capture, e.g.:
135Xe capturing a neutron and becoming nonradioactive 136Xe, rather than decaying to 135Cs which is radioactive with a halflife of 2.3 million years- Nonradioactive 133Cs capturing a neutron and becoming 134Cs which is radioactive with a halflife of 2 years
- Many of the fission products with mass 147 or greater such as 147Pm, 149Sm, 151Sm, and 155Eu have significant cross sections for neutron capture, so that one heavy fission product atom can undergo multiple successive neutron captures.
Besides fission products, the other types of radioactive products are
plutonium containing 238Pu, 239Pu, 240Pu, 241Pu, and 242Pu,
minor actinides including 237Np, 241Am, 243Am, curium isotopes, and perhaps californium
reprocessed uranium containing 236U and other isotopes- tritium
activation products of neutron capture by the reactor or bomb structure or the environment
Ordered by yield (thermal neutron fission of U-235)
| Yield | Element | Isotope | Halflife | Comment |
|---|---|---|---|---|
| 6.7896% | Caesium | 133Cs → 134Cs | 2.065 y | neutron capture (29 barns) slowly converts stable 133Cs to 134Cs, which itself is low-yield because beta decay stops at 134Xe; can be further converted (140 barns) to 135Cs |
| 6.3333% | Iodine, Xenon | 135I → 135Xe | 6.57 h | most important neutron poison; neutron capture converts 10%–50% of 135Xe to 136Xe; remainder decays (9.14h) to 135Cs (2.3My) |
| 6.2956% | Zirconium | 93Zr | 1.53 My | |
| 6.1% | Molybdenum | 99Mo | 65.94 h | Its daughter nuclide 99mTc is important in medical diagnosing. |
| 6.0899% | Caesium | 137Cs | 30.17 y | |
| 6.0507% | Technetium | 99Tc | 211 ky | Candidate for disposal by nuclear transmutation |
| 5.7518% | Strontium | 90Sr | 28.9 y | |
| 2.8336% | Iodine | 131I | 8.02 d | |
| 2.2713% | Promethium | 147Pm | 2.62 y | |
| 1.0888% | Samarium | 149Sm | virtually stable | 2nd most significant neutron poison |
| 0.9%[3] | Iodine | 129I | 15.7 My | Candidate for disposal by nuclear transmutation |
| 0.4203% | Samarium | 151Sm | 90 y | neutron poison; most will be converted to stable 152Sm |
| 0.3912% | Ruthenium | 106Ru | 373.6 d | |
| 0.2717% | Krypton | 85Kr | 10.78 y | |
| 0.1629% | Palladium | 107Pd | 6.5 My | |
| 0.0508% | Selenium | 79Se | 327 ky | |
| 0.0330% | Europium, Gadolinium | 155Eu → 155Gd | 4.76 y | both neutron poisons, most will be destroyed while fuel still in use |
| 0.0297% | Antimony | 125Sb | 2.76 y | |
| 0.0236% | Tin | 126Sn | 230 ky | |
| 0.0065% | Gadolinium | 157Gd | stable | neutron poison |
| 0.0003% | Cadmium | 113mCd | 14.1 y | neutron poison, most will be destroyed while fuel still in use |

Yields at 100,1,2,3 years after fission, probably of Pu-239 not U-235 because left hump is shifted right, not considering later neutron capture, fraction of 100% not 200%. Beta decay Kr-85→Rb, Sr-90→Zr, Ru-106→Pd, Sb-125→Te, Cs-137→Ba, Ce-144→Nd, Sm-151→Eu, Eu-155→Gd visible.
Cumulative Fission Yields
Cumulative fission yields give the amounts of nuclides produced either directly in the fission or by decay of other nuclides.
| Product | Thermal Fission Yield | Fast Fission Yield | 14-MeV Fission Yield |
|---|---|---|---|
| 1 1H | 0.00171 ± 0.00018 | 0.00269 ± 0.00044 | 0.00264 ± 0.00045 |
| 2 1H | 0.00084 ± 0.00015 | 0.00082 ± 0.00012 | 0.00081 ± 0.00012 |
| 3 1H | 0.0108 ± 0.0004 | 0.0108 ± 0.0004 | 0.0174 ± 0.0036 |
| 3 2He | 0.0108 ± 0.0004 | 0.0108 ± 0.0004 | 0.0174 ± 0.0036 |
| 4 2He | 0.1702 ± 0.0049 | 0.17 ± 0.0049 | 0.1667 ± 0.0088 |
| 85 35Br | 1.304 ± 0.012 | 1.309 ± 0.043 | 1.64 ± 0.31 |
| 82 36Kr | 0.000285 ± 0.000076 | 0.00044 ± 0.00016 | 0.038 ± 0.012 |
| 85 36Kr | 0.286 ± 0.021 | 0.286 ± 0.026 | 0.47 ± 0.1 |
| 85m 36Kr | 1.303 ± 0.012 | 1.307 ± 0.043 | 1.65 ± 0.31 |
| 90 38Sr | 5.73 ± 0.13 | 5.22 ± 0.18 | 4.41 ± 0.18 |
| 95 40Zr | 6.502 ± 0.072 | 6.349 ± 0.083 | 5.07 ± 0.19 |
| 94 41Nb | 0.00000042 ± 0.00000011 | 2.90 x 10⁻⁸ ± 7.70 x 10⁻⁹ | 0.00004 ± 0.000015 |
| 95 41Nb | 6.498 ± 0.072 | 6.345 ± 0.083 | 5.07 ± 0.19 |
| 95m 41Nb | 0.0702 ± 0.0067 | 0.0686 ± 0.0071 | 0.0548 ± 0.0072 |
| 92 42Mo | 0 ± 0 | 0 ± 0 | 0 ± 0 |
| 94 42Mo | 8.70 x 10⁻¹⁰ ± 3.20 x 10⁻¹⁰ | 0 ± 0 | 6.20 x 10⁻⁸ ± 2.50 x 10⁻⁸ |
| 96 42Mo | 0.00042 ± 0.00015 | 0.000069 ± 0.000025 | 0.0033 ± 0.0015 |
| 99 42Mo | 6.132 ± 0.092 | 5.8 ± 0.13 | 5.02 ± 0.13 |
| 99 43Tc | 6.132 ± 0.092 | 5.8 ± 0.13 | 5.02 ± 0.13 |
| 103 44Ru | 3.103 ± 0.084 | 3.248 ± 0.042 | 3.14 ± 0.11 |
| 106 44Ru | 0.41 ± 0.011 | 0.469 ± 0.036 | 2.15 ± 0.59 |
| 106 45Rh | 0.41 ± 0.011 | 0.469 ± 0.036 | 2.15 ± 0.59 |
| 121m 50Sn | 0.00106 ± 0.00011 | 0.0039 ± 0.00091 | 0.142 ± 0.023 |
| 122 51Sb | 0.000000366 ± 0.000000098 | 0.0000004 ± 0.00000014 | 0.00193 ± 0.00068 |
| 124 51Sb | 0.000089 ± 0.000021 | 0.000112 ± 0.000034 | 0.027 ± 0.01 |
| 125 51Sb | 0.026 ± 0.0014 | 0.067 ± 0.011 | 1.42 ± 0.42 |
| 132 52Te | 4.276 ± 0.043 | 4.639 ± 0.065 | 3.85 ± 0.16 |
| 129 53I | 0.706 ± 0.032 | 1.03 ± 0.26 | 1.59 ± 0.18 |
| 131 53I | 2.878 ± 0.032 | 3.365 ± 0.054 | 4.11 ± 0.14 |
| 133 53I | 6.59 ± 0.11 | 6.61 ± 0.13 | 5.42 ± 0.4 |
| 135 53I | 6.39 ± 0.22 | 6.01 ± 0.18 | 4.8 ± 1.4 |
| 128 54Xe | 0 ± 0 | 0 ± 0 | 0.00108 ± 0.00048 |
| 130 54Xe | 0.000038 ± 0.0000098 | 0.000152 ± 0.000055 | 0.038 ± 0.014 |
| 131m 54Xe | 0.0313 ± 0.003 | 0.0365 ± 0.0031 | 0.047 ± 0.0049 |
| 133 54Xe | 6.6 ± 0.11 | 6.61 ± 0.13 | 5.57 ± 0.41 |
| 133m 54Xe | 0.189 ± 0.015 | 0.19 ± 0.015 | 0.281 ± 0.049 |
| 135 54Xe | 6.61 ± 0.22 | 6.32 ± 0.18 | 6.4 ± 1.8 |
| 135m 54Xe | 1.22 ± 0.12 | 1.23 ± 0.13 | 2.17 ± 0.66 |
| 134 55Cs | 0.0000121 ± 0.0000032 | 0.0000279 ± 0.0000073 | 0.0132 ± 0.0035 |
| 137 55Cs | 6.221 ± 0.069 | 5.889 ± 0.096 | 5.6 ± 1.3 |
| 140 56Ba | 6.314 ± 0.095 | 5.959 ± 0.048 | 4.474 ± 0.081 |
| 140 57La | 6.315 ± 0.095 | 5.96 ± 0.048 | 4.508 ± 0.081 |
| 141 58Ce | 5.86 ± 0.15 | 5.795 ± 0.081 | 4.44 ± 0.2 |
| 144 58Ce | 5.474 ± 0.055 | 5.094 ± 0.076 | 3.154 ± 0.038 |
| 144 59Pr | 5.474 ± 0.055 | 5.094 ± 0.076 | 3.155 ± 0.038 |
| 142 60Nd | 6.30 x 10⁻⁹ ± 1.70 x 10⁻⁹ | 1.70 x 10⁻⁹ ± 4.80 x 10⁻¹⁰ | 0.0000137 ± 0.0000049 |
| 144 60Nd | 5.475 ± 0.055 | 5.094 ± 0.076 | 3.155 ± 0.038 |
| 147 60Nd | 2.232 ± 0.04 | 2.148 ± 0.028 | 1.657 ± 0.045 |
| 147 61Pm | 2.232 ± 0.04 | 2.148 ± 0.028 | 1.657 ± 0.045 |
| 148 61Pm | 5.00 x 10⁻⁸ ± 1.70 x 10⁻⁸ | 7.40 x 10⁻⁹ ± 2.50 x 10⁻⁹ | 0.0000013 ± 0.00000042 |
| 148m 61Pm | 0.000000104 ± 0.000000039 | 1.78 x 10⁻⁸ ± 6.60 x 10⁻⁹ | 0.0000048 ± 0.0000018 |
| 149 61Pm | 1.053 ± 0.021 | 1.064 ± 0.03 | 0.557 ± 0.09 |
| 151 61Pm | 0.4204 ± 0.0071 | 0.431 ± 0.015 | 0.388 ± 0.061 |
| 148 62Sm | 0.000000149 ± 0.000000041 | 2.43 x 10⁻⁸ ± 6.80 x 10⁻⁹ | 0.0000058 ± 0.0000018 |
| 150 62Sm | 0.000061 ± 0.000022 | 0.0000201 ± 0.0000077 | 0.00045 ± 0.00018 |
| 151 62Sm | 0.4204 ± 0.0071 | 0.431 ± 0.015 | 0.388 ± 0.061 |
| 153 62Sm | 0.1477 ± 0.0071 | 0.1512 ± 0.0097 | 0.23 ± 0.015 |
| 151 63Eu | 0.4204 ± 0.0071 | 0.431 ± 0.015 | 0.388 ± 0.061 |
| 152 63Eu | 3.24 x 10⁻¹⁰ ± 8.50 x 10⁻¹¹ | 0 ± 0 | 3.30 x 10⁻⁸ ± 1.10 x 10⁻⁸ |
| 154 63Eu | 0.000000195 ± 0.000000064 | 4.00 x 10⁻⁸ ± 1.10 x 10⁻⁸ | 0.0000033 ± 0.0000011 |
| 155 63Eu | 0.0308 ± 0.0013 | 0.044 ± 0.01 | 0.088 ± 0.014 |
| Product | Thermal Fission Yield | Fast Fission Yield | 14-MeV Fission Yield |
|---|---|---|---|
| 1 1H | 0.00408 ± 0.00041 | 0.00346 ± 0.00057 | - |
| 2 1H | 0.00135 ± 0.00019 | 0.00106 ± 0.00016 | - |
| 3 1H | 0.0142 ± 0.0007 | 0.0142 ± 0.0007 | - |
| 3 2He | 0.0142 ± 0.0007 | 0.0142 ± 0.0007 | - |
| 4 2He | 0.2192 ± 0.009 | 0.219 ± 0.009 | - |
| 85 35Br | 0.574 ± 0.026 | 0.617 ± 0.049 | - |
| 82 36Kr | 0.00175 ± 0.0006 | 0.00055 ± 0.0002 | - |
| 85 36Kr | 0.136 ± 0.014 | 0.138 ± 0.017 | - |
| 85m 36Kr | 0.576 ± 0.026 | 0.617 ± 0.049 | - |
| 90 38Sr | 2.013 ± 0.054 | 2.031 ± 0.057 | - |
| 95 40Zr | 4.949 ± 0.099 | 4.682 ± 0.098 | - |
| 94 41Nb | 0.0000168 ± 0.0000045 | 0.00000255 ± 0.00000069 | - |
| 95 41Nb | 4.946 ± 0.099 | 4.68 ± 0.098 | - |
| 95m 41Nb | 0.0535 ± 0.0066 | 0.0506 ± 0.0062 | - |
| 92 42Mo | 0 ± 0 | 0 ± 0 | - |
| 94 42Mo | 3.60 x 10⁻⁸ ± 1.30 x 10⁻⁸ | 4.80 x 10⁻⁹ ± 1.70 x 10⁻⁹ | - |
| 96 42Mo | 0.0051 ± 0.0018 | 0.0017 ± 0.00062 | - |
| 99 42Mo | 6.185 ± 0.056 | 5.82 ± 0.13 | - |
| 99 43Tc | 6.184 ± 0.056 | 5.82 ± 0.13 | - |
| 103 44Ru | 6.948 ± 0.083 | 6.59 ± 0.16 | - |
| 106 44Ru | 4.188 ± 0.092 | 4.13 ± 0.24 | - |
| 106 45Rh | 4.188 ± 0.092 | 4.13 ± 0.24 | - |
| 121m 50Sn | 0.0052 ± 0.0011 | 0.0053 ± 0.0012 | - |
| 122 51Sb | 0.000024 ± 0.0000063 | 0.0000153 ± 0.000005 | - |
| 124 51Sb | 0.00228 ± 0.00049 | 0.00154 ± 0.00043 | - |
| 125 51Sb | 0.117 ± 0.015 | 0.138 ± 0.022 | - |
| 132 52Te | 5.095 ± 0.094 | 4.92 ± 0.32 | - |
| 129 53I | 1.407 ± 0.086 | 1.31 ± 0.13 | - |
| 131 53I | 3.724 ± 0.078 | 4.09 ± 0.12 | - |
| 133 53I | 6.97 ± 0.13 | 6.99 ± 0.33 | - |
| 135 53I | 6.33 ± 0.23 | 6.24 ± 0.22 | - |
| 128 54Xe | 0.00000234 ± 0.00000085 | 0.0000025 ± 0.0000012 | - |
| 130 54Xe | 0.00166 ± 0.00056 | 0.00231 ± 0.00085 | - |
| 131m 54Xe | 0.0405 ± 0.004 | 0.0444 ± 0.0044 | - |
| 133 54Xe | 6.99 ± 0.13 | 7.03 ± 0.33 | - |
| 133m 54Xe | 0.216 ± 0.016 | 0.223 ± 0.021 | - |
| 135 54Xe | 7.36 ± 0.24 | 7.5 ± 0.23 | - |
| 135m 54Xe | 1.78 ± 0.21 | 1.97 ± 0.25 | - |
| 134 55Cs | 0.00067 ± 0.00018 | 0.00115 ± 0.0003 | - |
| 137 55Cs | 6.588 ± 0.08 | 6.35 ± 0.12 | - |
| 140 56Ba | 5.322 ± 0.059 | 5.303 ± 0.074 | - |
| 140 57La | 5.333 ± 0.059 | 5.324 ± 0.075 | - |
| 141 58Ce | 5.205 ± 0.073 | 5.01 ± 0.16 | - |
| 144 58Ce | 3.755 ± 0.03 | 3.504 ± 0.053 | - |
| 144 59Pr | 3.756 ± 0.03 | 3.505 ± 0.053 | - |
| 142 60Nd | 0.00000145 ± 0.0000004 | 0.00000251 ± 0.00000072 | - |
| 144 60Nd | 3.756 ± 0.03 | 3.505 ± 0.053 | - |
| 147 60Nd | 2.044 ± 0.039 | 1.929 ± 0.046 | - |
| 147 61Pm | 2.044 ± 0.039 | 1.929 ± 0.046 | - |
| 148 61Pm | 0.0000056 ± 0.0000019 | 0.000012 ± 0.000004 | - |
| 148m 61Pm | 0.0000118 ± 0.0000044 | 0.000029 ± 0.000011 | - |
| 149 61Pm | 1.263 ± 0.032 | 1.275 ± 0.056 | - |
| 151 61Pm | 0.776 ± 0.018 | 0.796 ± 0.037 | - |
| 148 62Sm | 0.0000168 ± 0.0000046 | 0.000039 ± 0.000011 | - |
| 150 62Sm | 0.00227 ± 0.00078 | 0.0051 ± 0.0019 | - |
| 151 62Sm | 0.776 ± 0.018 | 0.797 ± 0.037 | - |
| 153 62Sm | 0.38 ± 0.03 | 0.4 ± 0.18 | - |
| 151 63Eu | 0.776 ± 0.018 | 0.797 ± 0.037 | - |
| 152 63Eu | 0.000000195 ± 0.00000005 | 0.00000048 ± 0.00000014 | - |
| 154 63Eu | 0.000049 ± 0.000012 | 0.000127 ± 0.000043 | - |
| 155 63Eu | 0.174 ± 0.03 | 0.171 ± 0.054 | - |
| JEFF-3.1 | Joint Evaluated Fission and Fusion File, Incident-neutron data, http://www-nds.iaea.org/exfor/endf00.htm, 2 October 2006; |
Yields at 100,1,2,3 years after fission, probably of Pu-239 not U-235 because left hump is shifted right, not considering later neutron capture, fraction of 100% not 200%. Beta decay Kr-85→Rb, Sr-90→Zr, Ru-106→Pd, Sb-125→Te, Cs-137→Ba, Ce-144→Nd, Sm-151→Eu, Eu-155→Gd visible.
Ordered by mass number (thermal fission)
| Yield | Isotope | ||
|---|---|---|---|
| 0.0508% | selenium-79 | ||
| 0.2717% | krypton-85 | ||
| 5.7518% | strontium-90 → | Yttrium-90 | |
| 6.2956% | zirconium-93 → | Niobium-93 | |
| 6.0507% | technetium-99 | ||
| 0.3912% | ruthenium-106 | ||
| 0.1629% | palladium-107 | ||
| 0.0003% | cadmium-113m | ||
| 0.0297% | antimony-125 | ||
| 0.0236% | tin-126 → | antimony-126 | |
| 0.9% | iodine-129 | ||
| 2.8336% | iodine-131 | ||
| 6.7896% | caesium-133 → | caesium-134 | |
| 6.3333% | iodine-135 → | xenon-135 → | caesium-135 |
| 6.0899% | caesium-137 | ||
| 2.2713% | promethium-147 | ||
| 1.0888% | samarium-149 | ||
| 0.4203% | samarium-151 | ||
| 0.0330% | europium-155 → | gadolinium-155 | |
| 0.0065% | gadolinium-157 |
Half lives, decay modes, and branching fractions
| Nuclide | Half-life | Decay mode | Branching fraction | Source | Notes |
|---|---|---|---|---|---|
| 85 35Br | 2.9 ± 0.06 m | β− | 1.0 | ENSDF | [1] |
| 85 36Kr | 10.752 ± 0.023 y | β− | 1.0 | BIPM-5 | |
| 85m 36Kr | 4.48 ± 0.008 h | IT | 0.214 ± 0.005 | ENSDF | |
| β− | 0.786 ± 0.005 | ||||
| 90 38Sr | 28.8 ± 0.07 y | β− | 1.0 | LNHB | |
| 95 40Zr | 64.032 ± 0.006 d | β− | 1.0 | LNHB | |
| 94 41Nb | ( 7.3 ± 0.9 ) x 106 d | β− | 1.0 | IAEA-CRP-XG | |
| 95m 41Nb | 3.61 ± 0.03 d | β− | 0.025 ± 0.001 | LNHB | [2] |
| IT | 0.975 ± 0.001 | ||||
| 95 41Nb | 34.985 ± 0.012 d | β− | 1.0 | IAEA-CRP-XG | |
| 99 43Tc | (2.111 ± 0.012) x 105 y | β− | 1.0 | ENSDF | |
| 103 44Ru | 39.247 ± 0.013 d | β− | 1.0 | IAEA-CRP-XG | |
| 106 44Ru | 1.018 ± 0.005 y | β− | 1.0 | IAEA-CRP-XG | |
| 106 45Rh | 30.1 ± 0.3 s | β− | 1.0 | IAEA-CRP-XG | |
| 121m 50Sn | 55 ± 5 y | β− | 0.224 ± 0.02 | ENSDF | |
| IT | 0.776 ± 0.02 | ||||
| 122 51Sb | 2.7238 ± 0.0002 d | EC | 0.0241 ± 0.0012 | ENSDF | |
| β− | 0.9759 ± 0.0012 | ||||
| 124 51Sb | 60.2 ± 0.03 d | β− | 1.0 | ENSDF | |
| 125 51Sb | 2.7584 ± 0.0006 y | β− | 1.0 | IAEA-CRP-XG | |
| 129 53I | ( 5.89 ± 0.23 ) x 109 d | β− | 1.0 | IAEA-CRP-XG | |
| 131 53I | 8.0233 ± 0.0019 d | β− | 1.0 | BIPM-5 | |
| 133 53I | 20.87 ± 0.08 h | β− | 1.0 | LNHB | [3] |
| 135 53I | 6.57 ± 0.02 h | β− | 1.0 | ENSDF | |
| 131m 54Xe | 11.930 ± 0.016 d | IT | 1.0 | BIPM-5 | |
| 133 54Xe | 5.243 ± 0.001 d | β− | 1.0 | ENSDF | |
| 133m 54Xe | 2.19 ± 0.01 d | IT | 1.0 | ENSDF | |
| 135 54Xe | 9.14 ± 0.02 h | β− | 1.0 | ENSDF | |
| 135m 54Xe | 15.29 ± 0.05 m | β− | 0.003 ± 0.003 | ENSDF | [4] |
| IT | 0.997 ± 0.003 | ||||
| 134 55Cs | 2.063 ± 0.003 y | EC | 0.000003 ± 0.000001 | IAEA-CRP-XG | [5] |
| β− | 0.999997 ± 0.000001 | ||||
| 137 55Cs | 30.05 ± 0.08 y | β− | 1.0 | IAEA-CRP-XG | |
| 140 56Ba | 12.753 ± 0.004 d | β− | 1.0 | BIPM-5 | |
| 140 57La | 1.67850 ± 0.00017 d | β− | 1.0 | BIPM-5 | |
| 141 58Ce | 32.508 ± 0.010 d | β− | 1.0 | LNHB | |
| 144 58Ce | 285.1 ± 0.6 d | β− | 1.0 | IAEA-CRP-XG | |
| 144 59Pr | 17.28 ± 0.05 m | β− | 1.0 | ENSDF | |
| 147 60Nd | 10.98 ± 0.01 d | β− | 1.0 | ENSDF | |
| 147 61Pm | 2.6234 ± 0.0002 y | β− | 1.0 | ENSDF | |
| 148m 61Pm | 41.29 ± 0.11 d | IT | 0.042 ± 0.007 | ENSDF | |
| β− | 0.958 ± 0.007 | ||||
| 148 61Pm | 5.368 ± 0.002 d | β− | 1.0 | ENSDF | |
| 149 61Pm | 2.2117 ± 0.0021 d | β− | 1.0 | ENSDF | |
| 151 61Pm | 1.1833 ± 0.0017 d | β− | 1.0 | ENSDF | |
| 151 62Sm | 90 ± 6 y | β− | 1.0 | ENSDF | |
| 153 62Sm | 1.938 ± 0.010 d | β− | 1.0 | IAEA-CRP-XG | |
| 152 63Eu | ( 4.941 ± 0.007 ) x 103 d | β− | 0.279 ± 0.003 | IAEA-CRP-XG | [6] |
| EC | 0.721 ± 0.003 | ||||
| 154 63Eu | ( 3.1381 ± 0.0014 ) x 103 d | EC | 0.00018 ± 0.00013 | IAEA-CRP-XG | [6] |
| β− | 0.99982 ± 0.00013 | ||||
| 155 63Eu | 4.753 ± 0.016 y | β− | 1.0 | IAEA-CRP-XG |
| BIPM-5 | M.-M. Bé, V. Chisté, C. Dulieu, E. Browne, V. Chechev, N. Kuzmenko, R. Helmer, A. Nichols, E. Schönfeld, R. Dersch, Monographie BIPM-5, Table of Radionuclides, Vol. 2 - A = 151 to 242, 2004. |
| LNHB | Laboratoire National Henri Becquerel, Recommended Data, http://www.nucleide.org/DDEP_WG/DDEPdata.htm, 16 January 2006. |
| IAEA-CRP-XG | M.-M. Bé, V.P. Chechev, R. Dersch, O.A.M. Helene, R.G. Helmer, M. Herman, S. Hlavác, A. Marcinkowski, G.L. Molnár, A.L. Nichols, E. Schönfeld, V.R. Vanin, M.J. Woods, IAEA CRP "Update of X-ray and Gamma-ray Decay Data Standards for Detector Calibration and Other Applications", IAEA Scientific and Technical Information report STI/PUB/1287, May 2007, International Atomic Energy Agency, Vienna, Austria, ISBN 92-0-113606-4. |
| ENSDF | Evaluated Nuclear Structure Data File, http://www-nds.iaea.org/ensdf/, 26 January 2006. |
| [1] β- decay branches of 0.9982 ± 0.0002 to Kr-85m and 0.0018 ± 0.0002 to Kr-85. |
| [2] ENSDF branching fractions: 0.944 ± 0.007 for IT and 0.056 ± 0.007 for β-. |
| [3] β- decay branch of 0.0288 ± 0.0002 to Xe-133m. |
| [4] Branching fractions were averaged from ENSDF database. |
| [5] Branching fractions were adopted from ENSDF database. |
| [6] Branching fractions were adopted from LNHB data. |
Ordered by thermal neutron neutron absorption cross section
| Barns | Yield | Isotope | t½ | Comment |
|---|---|---|---|---|
7006265000000000000♠2,650,000 | 6.3333% | 135I → 135Xe | 6.57 h | Most important neutron poison; neutron capture rapidly converts 135Xe to 136Xe; remainder decays (9.14 h) to 135Cs (2.3 My) |
7005254000000000000♠254,000 | 0.0065% | 157Gd | ∞ | neutron poison, but low yield |
7004401400000000000♠40,140 | 1.0888% | 149Sm | ∞ | 2nd most important neutron poison |
7004206000000000000♠20,600 | 0.0003% | 113mCd | 14.1 y | most will be destroyed by neutron capture |
7004152000000000000♠15,200 | 0.4203% | 151Sm | 90 y | most will be destroyed by neutron capture |
7003395000000000000♠3,950 60,900 | 0.0330% | 155Eu → 155Gd | 4.76 y | both neutron poisons |
7001960000000000000♠96 | 2.2713% | 147Pm | 2.62 y | |
7001800000000000000♠80 | 2.8336% | 131I | 8.02 d | |
7001290000000000000♠29 140 | 6.7896% | 133Cs → 134Cs | ∞ 2.065 y | neutron capture converts a few percent of nonradioactive 133Cs to 134Cs, which has very low direct yield because beta decay stops at 134Xe; further capture will add to long-lived 135Cs |
7001200000000000000♠20 | 6.0507% | 99Tc | 211 ky | candidate for disposal by nuclear transmutation |
7001180000000000000♠18 | 0.6576% | 129I | 15.7 My | candidate for disposal by nuclear transmutation |
7000270000000000000♠2.7 | 6.2956% | 93Zr | 1.53 My | transmutation impractical |
7000180000000000000♠1.8 | 0.1629% | 107Pd | 6.5 My | |
7000166000000000000♠1.66 | 0.2717% | 85Kr | 10.78 y | |
6999900000000000000♠0.90 | 5.7518% | 90Sr | 28.9 y | |
6999150000000000000♠0.15 | 0.3912% | 106Ru | 373.6 d | |
6999110000000000000♠0.11 | 6.0899% | 137Cs | 30.17 y | |
| 0.0297% | 125Sb | 2.76 y | ||
| 0.0236% | 126Sn | 230 ky | ||
| 0.0508% | 79Se | 327 ky |
References
^ fissionyield
^ Möller, P; Madland, DG; Sierk, AJ; Iwamoto, A (15 February 2001). "Nuclear fission modes and fragment mass asymmetries in a five-dimensional deformation space". Nature. 409: 785–790. Bibcode:2001Natur.409..785M. doi:10.1038/35057204. PMID 11236985. Retrieved 12 November 2016.
^ Purkayastha, B. C., and G. R. Martin. "The yields of 129I in natural and in neutron-induced fission of uranium." Canadian Journal of Chemistry 34.3 (1956): 293-300.
^ ab "Cumulative Fission Yields". www-nds.iaea.org. IAEA. Retrieved 11 November 2016.
External links
- HANDBOOK OF NUCLEAR DATA FOR SAFEGUARDS: DATABASE EXTENSIONS, AUGUST 2008
 The Live Chart of Nuclides - IAEA Color-map of yields, and detailed data by click on a nuclide.


