List of Western Australian Legislative Assembly elections
This article provides a summary of results for elections to the Western Australian Legislative Assembly, the lower house in Western Australia's bicameral state legislative body, the Parliament of Western Australia, which came into being in 1890 when Western Australia achieved responsible self-government. The number of seats has increased over time, from 30 at its first election, to the current total of 57 seats. Western Australian politics were initially non-partisan, with individual Members of Parliament choosing to align either with the Government or the Opposition. This began to change in the 1901 election with the election of six Labor members, and then with Labor attaining outright victory in the 1904 election. By 1911, a rival party to Labor had emerged in the centre-right Liberal Party of Western Australia, which many of the former independents had joined.[1] This entity evolved into the Nationalist Party and eventually into the Liberal Party in 1944.[2]
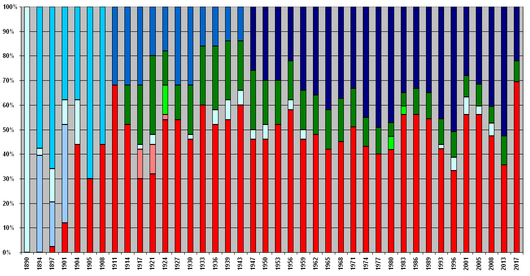
The chart below shows the information graphically, with the most recent results on the right. It shows the popularity in terms of seats won, of the Labor Party (red) and the Nationalist Party and its predecessors (mid-blue) in the first half of the 20th century, as well as the emergence of the Country Party (green) in 1914, with whom the Nationalists and later the Liberals formed a coalition in order to form government. Two distinct periods were characterised by one party or coalition's dominance—the Labor Party won six of the seven elections between 1924 and 1947, and the Liberal Party (dark blue) in coalition with the Country Party won seven of the eight elections between 1959 and 1983. Occasional internal splits within the Country Party, now known as the Nationals, are also shown on the chart in differing shades of green.
 | |
| |||||||||||||||||||||||
Contents
1 Summary of results
1.1 Elections prior to political parties
1.2 Notes
2 Interpretation issues
3 References
4 See also
Summary of results
The table below shows the total number of seats won by the major political parties at each election. The totals of the winning party or coalition are shown in bold, while other parties in government are shown in bold italic. Full details on any election are linked via the year of the election at the start of the row.
| Election | Date | Total seats | Labor | Liberal [A] | Nationalist [B] | Country/ National [C] | Nat. Lab. [D] | Independent | Other Parties | ||
|---|---|---|---|---|---|---|---|---|---|---|---|
40th | 11 March 2017 | 59 | 41 | 13 | 5 | ||||||
39th | 9 March 2013 | 59 | 21 | 31 | 7 | ||||||
38th | 6 September 2008 | 59 | 28 | 24 | 4 | 3 | |||||
37th | 26 February 2005 | 57 | 32 | 18 | 5 | 2 | |||||
36th | 10 February 2001 | 57 | 32 | 16 | 5 | 4 | |||||
35th | 14 December 1996 | 57 | 19 | 29 | 6 | 3 | |||||
34th | 6 February 1993 | 57 | 24 | 26 | 6 | 1 | |||||
33rd | 4 February 1989 | 57 | 31 | 20 | 6 | ||||||
32nd | 8 February 1986 | 57 | 32 | 19 | 6 | ||||||
31st | 19 February 1983 | 57 | 32 | 20 | 3 | 2 | National [C] | ||||
30th | 23 February 1980 | 55 | 23 | 26 | 3 | 3 | National [C] | ||||
29th | 19 February 1977 | 55 | 22 | 27 | 6 | ||||||
28th | 30 March 1974 | 51 | 22 | 23 | 6 | ||||||
27th | 20 February 1971 | 51 | 26 | 17 | 8 | ||||||
26th | 23 March 1968 | 51 | 23 | 19 | 9 | ||||||
25th | 20 February 1965 | 50 | 21 | 21 | 8 | ||||||
24th | 31 March 1962 | 50 | 24 | 18 | 8 | ||||||
23rd | 21 March 1959 | 50 | 23 | 17 | 8 | 2 | |||||
22nd | 7 April 1956 | 50 | 29 | 11 | 8 | 2 | |||||
21st | 14 February 1953 | 50 | 26 | 15 | 9 | ||||||
20th | 25 March 1950 | 50 | 23 | 15 | 9 | 3 | |||||
19th | 15 March 1947 | 50 | 23 | 13 | 12 | 2 | |||||
18th | 20 November 1943 | 50 | 30 | 7 | 10 | 3 | |||||
17th | 18 March 1939 | 50 | 27 | 7 | 12 | 4 | |||||
16th | 15 February 1936 | 50 | 26 | 8 | 13 | 3 | |||||
15th | 8 April 1933 | 50 | 30 | 8 | 12 | ||||||
14th | 26 March 1930 | 50 | 23 | 16 | 10 | 1 | |||||
13th | 26 March 1927 | 50 | 27 | 16 | 7 | ||||||
12th | 22 March 1924 | 50 | 27 | 9 | 1 | 7 6 | MCP ECP[3] | ||||
11th | 12 March 1921 | 50 | 16 | 10 | 16 | 6 | 2 | ||||
10th | 29 September 1917 | 50 | 15 | 16 | 12 | 6 | 1 | ||||
9th | 21 October 1914 | 50 | 26 | 16 | 8 | ||||||
8th | 3 October 1911 | 50 | 34 | 16 | |||||||
7th | 11 September 1908 | 50 | 22 | 28 | |||||||
6th | 27 October 1905 | 50 | 15 | 35 | |||||||
5th | 28 June 1904 | 50 | 22 | 19 | 9 | ||||||
Elections prior to political parties
Until the 1904 election, most candidates did not belong to political parties. However, some candidates declared their support for the administration of the time, while others declared their opposition to it. Full details on any election are linked via the year of the election at the start of the row.
| Election | Date | Seats | Government | Opposition | Independent | Labor |
|---|---|---|---|---|---|---|
4th | April 1901 | 50 | 19 | 20 | 5 | 6 |
3rd | May 1897 | 44 | 29 | 8 | 7 | |
2nd | June 1894 | 33 | 19 | 13 | 1 | |
1st | December 1890 | 30 | 30 |
Notes
A The Liberal Party was known as the Liberal and Country League from 1949 until 1968.
B Includes results for the Western Australian Liberal Party from 1911 until 1917, and the Ministerial Party from 1904 until 1911.
C The party was known as the Country Party (1914–1946; 1962–1973), Country and Democratic League (1946–1962), National Alliance (1974), National Country Party (1975–1984) and National Party (1984–present). A separate National Party existed from 1978–1984 and is shown under "Other Parties".
D The National Labor Party were a split from the Labor Party which sat in coalition with the Nationalists between 1917 and 1924.
Interpretation issues
Two features of the Western Australian electoral system are worthy of note in interpreting election results. The first is that until the 1974 election, many seats in both houses were uncontested—usually more than one-quarter of all seats on offer.[4] Since 1974, only three seats have been uncontested—that being the seats of Collie and East Melville in the 1980 election, when the rival party's candidates missed the nomination deadline and hence could not stand, and the seat of Narrogin in the 1983 election.
The second feature is malapportionment, which until 2008 was a significant feature of the Western Australian political landscape. Seats in metropolitan and rural areas did not contain the same number of electors—as at 30 September 2007, a Member of the Legislative Assembly represented either 28,519 metropolitan voters within the Metropolitan Region Scheme area, or 14,551 country voters.[5] This was believed to disproportionately favour the Nationals in terms of parliamentary representation.[6] Reforms enacted in 2005 which took effect at the 2008 election produced an average district enrolment of 21,350, which applied to all but five of the 59 districts created in the 2007 redistribution. An allowance remained for particularly large districts—those of 100,000 square kilometres (39,000 sq mi) or more, located in the north and east of the State—in the form of a Large District Allowance.[7]
References
^ de Garis, Brian (1991). "Self-Government and the Emergence of Political Parties 1890–1911". In Black, David. The House on the Hill: A history of the Parliament of Western Australia. Parliament of Western Australia. pp. 81–82. ISBN 0-7309-3983-9..mw-parser-output cite.citation{font-style:inherit}.mw-parser-output .citation q{quotes:"""""""'""'"}.mw-parser-output .citation .cs1-lock-free a{background:url("//upload.wikimedia.org/wikipedia/commons/thumb/6/65/Lock-green.svg/9px-Lock-green.svg.png")no-repeat;background-position:right .1em center}.mw-parser-output .citation .cs1-lock-limited a,.mw-parser-output .citation .cs1-lock-registration a{background:url("//upload.wikimedia.org/wikipedia/commons/thumb/d/d6/Lock-gray-alt-2.svg/9px-Lock-gray-alt-2.svg.png")no-repeat;background-position:right .1em center}.mw-parser-output .citation .cs1-lock-subscription a{background:url("//upload.wikimedia.org/wikipedia/commons/thumb/a/aa/Lock-red-alt-2.svg/9px-Lock-red-alt-2.svg.png")no-repeat;background-position:right .1em center}.mw-parser-output .cs1-subscription,.mw-parser-output .cs1-registration{color:#555}.mw-parser-output .cs1-subscription span,.mw-parser-output .cs1-registration span{border-bottom:1px dotted;cursor:help}.mw-parser-output .cs1-ws-icon a{background:url("//upload.wikimedia.org/wikipedia/commons/thumb/4/4c/Wikisource-logo.svg/12px-Wikisource-logo.svg.png")no-repeat;background-position:right .1em center}.mw-parser-output code.cs1-code{color:inherit;background:inherit;border:inherit;padding:inherit}.mw-parser-output .cs1-hidden-error{display:none;font-size:100%}.mw-parser-output .cs1-visible-error{font-size:100%}.mw-parser-output .cs1-maint{display:none;color:#33aa33;margin-left:0.3em}.mw-parser-output .cs1-subscription,.mw-parser-output .cs1-registration,.mw-parser-output .cs1-format{font-size:95%}.mw-parser-output .cs1-kern-left,.mw-parser-output .cs1-kern-wl-left{padding-left:0.2em}.mw-parser-output .cs1-kern-right,.mw-parser-output .cs1-kern-wl-right{padding-right:0.2em}
^ Black, David (1981). "The Era of Labor Ascendancy 1924–1947". In Stannage, Tom. A New History of Western Australia. University of Western Australia Press. p. 439. ISBN 0-85564-170-3.
^ abc In 1923, the Country Party split into the Ministerial Country Party (MCP), with 15 members, and the Executive Country Party (ECP), with 3. At the 1924 election, the MCP won 7 seats and the ECP won 6—subsequently, the MCP merged with the Nationalists while the ECP reverted to the name Country Party. In 1978, a disagreement between those favouring coalition with the Liberals and those favouring independence resulted in the latter group splitting to form the National Party, while the original party remained as the National Country Party. In 1984, the two parties reunited, although the three NCP members ultimately joined the Liberal Party, with two of them losing to endorsed Nationals at the 1986 election. The Executive Country (1924) and National (1978–1984) parties are shaded light green in this list.
^ Black, p.110.
^ Western Australian Electoral Commission (30 September 2007). "September enrolment statistics" (PDF). Archived from the original (PDF) on 22 July 2008. Retrieved 15 January 2008.
^ Green, Antony (17 November 2004). "WA: A Peculiar Electoral System". Australian Broadcasting Corporation. Retrieved 19 January 2008.
^ Electoral Act 1907 (WA), s.16G (as added by No.1 of 2005, s.4.)
See also
- List of Western Australian state by-elections
- Electoral districts of Western Australia
- Timeline of Australian elections
| General elections |
|
|---|---|
| Legislative Council elections |
|
| Referendums |
|


