2002 United States House of Representatives elections
| ||||||||||||||||||||||||||||||||||||||||||||||||||||||||||||||||||||
All 435 seats to the United States House of Representatives 218 seats needed for a majority | ||||||||||||||||||||||||||||||||||||||||||||||||||||||||||||||||||||
|---|---|---|---|---|---|---|---|---|---|---|---|---|---|---|---|---|---|---|---|---|---|---|---|---|---|---|---|---|---|---|---|---|---|---|---|---|---|---|---|---|---|---|---|---|---|---|---|---|---|---|---|---|---|---|---|---|---|---|---|---|---|---|---|---|---|---|---|---|
| ||||||||||||||||||||||||||||||||||||||||||||||||||||||||||||||||||||
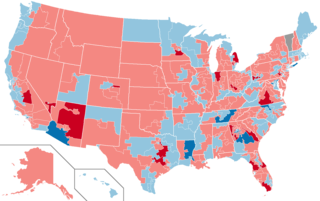 Results: Democratic hold Democratic gain Republican hold Republican gain Independent hold | ||||||||||||||||||||||||||||||||||||||||||||||||||||||||||||||||||||
| ||||||||||||||||||||||||||||||||||||||||||||||||||||||||||||||||||||

The elections for the United States House of Representatives were held on 5 November 2002, in the middle of President George W. Bush's first term. Although it was a midterm election, the Republican Party gained a net eight seats, solidifying their majority. Some speculate that this may have been due to increased support for the President's party in the wake of the September 11 attacks.[1]
This was one of two mid-term elections in which the party of the incumbent President increased their number of seats in both the House and the Senate (the other such mid-term elections were in 1934). It was the sixth midterm election in which the President's party increased its number of seats in the House, after 1814, 1822, 1902, 1934, and 1998), and is the only midterm election since 1978 which left the President's party in control of the House.
Contents
1 Overall results
2 Separate elections
3 November 5 elections
3.1 Alabama
3.2 Alaska
3.3 Arizona
3.4 Arkansas
3.5 California
3.6 Colorado
3.7 Connecticut
3.8 Delaware
3.9 Florida
3.10 Georgia
3.11 Hawaii
3.12 Idaho
3.13 Illinois
3.14 Indiana
3.15 Iowa
3.16 Kansas
3.17 Kentucky
3.18 Louisiana
3.19 Maine
3.20 Maryland
3.21 Massachusetts
3.22 Michigan
3.23 Minnesota
3.24 Mississippi
3.25 Missouri
3.26 Montana
3.27 Nebraska
3.28 Nevada
3.29 New Hampshire
3.30 New Jersey
3.31 New Mexico
3.32 New York
3.33 North Carolina
3.34 North Dakota
3.35 Ohio
3.36 Oklahoma
3.37 Oregon
3.38 Pennsylvania
3.39 Rhode Island
3.40 South Carolina
3.41 South Dakota
3.42 Tennessee
3.43 Texas
3.44 Utah
3.45 Vermont
3.46 Virginia
3.47 Washington
3.48 West Virginia
3.49 Wisconsin
3.50 Wyoming
4 See also
5 References
6 External links
Overall results
229 | 1 | 205 |
Republican | I | Democratic |
| Parties | Seats | Popular Vote | ||||||
|---|---|---|---|---|---|---|---|---|
2000 | 2002 | Net Change | Strength | Vote | % | Change | ||
Republican Party | 221 | 229 | 52.6% | 37,332,552 | 50.0% | +2.4% | ||
Democratic Party | 212 | 205 | 46.9% | 33,795,885 | 45.2% | -1.9% | ||
Libertarian Party | - | - | - | - | 1,050,776 | 1.4% | -0.2% | |
Independent | 2 | 1 | 0.2% | 398,398 | 0.5% | -0.2% | ||
Green Party | - | - | - | - | 297,187 | 0.4% | +0.1% | |
Constitution Party | - | - | - | - | 129,748 | 0.2% | +0.1% | |
Conservative Party | - | - | - | - | 48,232 | 0.1% | - | |
Right to Life Party | - | - | - | - | 35,951 | <0.1% | - | |
Reform Party | - | - | - | - | 29,964 | <0.1% | -0.2% | |
United Citizens Party | - | - | - | - | 27,030 | <0.1% | - | |
Independence Party | - | - | - | - | 25,543 | <0.1% | -0.1% | |
Natural Law Party | - | - | - | - | 18,505 | <0.1% | -0.4% | |
No New Taxes Party | - | - | - | - | 12,430 | <0.1% | - | |
Socialist Party | - | - | - | - | 7,359 | <0.1% | - | |
Lower Tax Independent Party | - | - | - | - | 4,466 | <0.1% | - | |
Liberty Union Party | - | - | - | - | 3,185 | <0.1% | - | |
Grassroots Party | - | - | - | - | 2,344 | <0.1% | - | |
Independent Home Protection Party | - | - | - | - | 2,327 | <0.1% | - | |
Working Families Party | - | - | - | - | 2,131 | <0.1% | - | |
One Earth Party | - | - | - | - | 1,544 | <0.1% | - | |
Liberal Party | - | - | - | - | 1,513 | <0.1% | - | |
Honesty, Humanity, Duty Party | - | - | - | - | 1,063 | <0.1% | - | |
Anti-Corruption Doctor Party | - | - | - | - | 740 | <0.1% | - | |
Pro Life Conservative Party | - | - | - | - | 732 | <0.1% | - | |
American First Party | - | - | - | - | 665 | <0.1% | - | |
Human Rights Advocate Party | - | - | - | - | 612 | <0.1% | - | |
Politicians are Crooks Party | - | - | - | - | 573 | <0.1% | - | |
Socialist Workers Party | - | - | - | - | 569 | <0.1% | - | |
American Party | - | - | - | - | 34 | <0.1% | - | |
| Others | - | - | - | - | 1,474,497 | 2.0% | +0.3% | |
Total | 435 | 434 | 0 | 100.0% | 74,706,555 | 100.0% | - | |
| Source: Election Statistics - Office of the Clerk | ||||||||

| 
| |||||||||||||||||
Separate elections
Two special elections were held apart from those on November 5 and serve the remainder of the term ending January 3, 2003.
| District | Incumbent | Party | First elected | Result | Candidates |
|---|---|---|---|---|---|
Oklahoma 1 | Steve Largent | Republican | 1994 (Special) | Incumbent resigned to run for Governor of Oklahoma. New member elected January 8, 2002. Republican hold. Winner was subsequently re-elected in November. | √ John Sullivan (Republican) 53.79% Doug Dodd (Democratic) 44.34% Neil Mavis (Libertarian) 1.53% David Fares (Independent) 0.34%[2] |
Hawaii 2 | Patsy Mink | Democratic | 1964 1976 (Retired) 1990 (Special) | Incumbent died September 28, 2002, but was posthumously re-elected, see below. New member elected November 30, 2002. Democratic hold. Winner was subsequently re-elected in a special election on January 4, 2003 for the next term. | √ Ed Case (Democratic) 51.44% John F. Mink (Democratic) 36.27% John Stanley Carroll (Republican) 4.22% Whitney Anderson (Republican) 2.06%[3] |
November 5 elections
Key to party abbreviations: AI=American Independent, C=Constitution, D=Democratic, G=Green, I=Independent, IP=Independence Party, L=Libertarian, R=Republican
Alabama
| District | Incumbent | Party | First elected | Result | Candidates |
|---|---|---|---|---|---|
Alabama 1 | Sonny Callahan | Republican | 1984 | Retired Republican hold | Jo Bonner (R) 60.5% Judy McCain Belk (D) 37.78% Dick Coffee (L) 1.65% |
Alabama 2 | Terry Everett | Republican | 1992 | Re-elected | Terry Everett (R) 68.75% Charles Woods (D) 29.52% Floyd Shackelford (L) 1.57% |
Alabama 3 | Bob Riley | Republican | 1996 | Retired to run for Governor Republican hold | Mike Rogers (R) 50.31% Joe Turnham (D) 48.20% George Crispin (L) 1.42% |
Alabama 4 | Robert Aderholt | Republican | 1996 | Re-elected | Robert Aderholt (R) 86.72% Tony Hughes McLendon (L) 12.95% |
Alabama 5 | Robert "Bud" Cramer | Democratic | 1990 | Re-elected | Robert "Bud" Cramer (D) 73.28% Stephen P. Engel (R) 24.71% Alan F. Barksdale (L) 1.93% |
Alabama 6 | Spencer Bachus | Republican | 1992 | Re-elected | Spencer Bachus (R) 89.83% J. Holden McAllister (L) 9.90% |
Alabama 7 | Earl Hilliard | Democratic | 1992 | Lost renomination Democratic hold | Artur Davis (D) 92.44% Lauren Orth McCay (L) 7.28% |
Alaska
| District | Incumbent | Party | First elected | Result | Candidates |
|---|---|---|---|---|---|
Alaska At-large | Don Young | Republican | 1972 | Re-elected | Don Young (R) 74.51% Clifford Mark Greene (D) 17.28% Russell F. DeForest (G) 6.34% Rob Clift (L) 1.67% |
Arizona
The state gained two seats in reapportionment.
| District | Incumbent | Party | First elected | Result | Candidates |
|---|---|---|---|---|---|
Arizona 1 | None (District created) | New seat Republican gain | Rick Renzi (R) 49.21% George Cordova (D) 45.64% Edwin Porr (L) 5.15% | ||
Arizona 2 | Bob Stump Redistricted from the 3rd district | Republican | 1976 | Retired Republican hold | Trent Franks (R) 59.92% Randy Camacho (D) 36.55% Edward Carlson (L) 3.53% |
Arizona 3 | John Shadegg Redistricted from the 4th district | Republican | 1994 | Re-elected | John Shadegg (R) 67.32% Charles Hill (D) 30.29% Mark Yannone (L) 2.40% |
Arizona 4 | Ed Pastor Redistricted from the 2nd district | Democratic | 1990 | Re-elected | Ed Pastor (D) 67.38% Jonathan Barnert (R) 27.82% Amy Gibbons (L) 4.79% |
Arizona 5 | J. D. Hayworth Redistricted from the 6th district | Republican | 1994 | Re-elected | J. D. Hayworth (R) 61.17% Craig Columbus (D) 36.25% Warren Severin (L) 2.58% |
Arizona 6 | Jeff Flake Redistricted from the 1st district | Republican | 2000 | Re-elected | Jeff Flake (R) 65.94% Deborah Thomas (D) 31.57% Andy Wagner (L) 2.49% |
Arizona 7 | None (District created) | New seat Democratic gain | Raul Grijalva (D) 59.00% Ross Hieb (R) 37.06% John Nemeth (L) 3.94% | ||
Arizona 8 | Jim Kolbe Redistricted from the 5th district | Republican | 1984 | Re-elected | Jim Kolbe (R) 63.33% Mary Judge Ryan (D) 33.59% Joe Duarte (L) 3.06% |
Arkansas
| District | Incumbent | Party | First elected | Result | Candidates |
|---|---|---|---|---|---|
Arkansas 1 | Marion Berry | Democratic | 1996 | Re-elected | Marion Berry (D) 66.84% Tommy F. Robinson (R) 33.16% |
Arkansas 2 | Vic Snyder | Democratic | 1996 | Re-elected | Vic Snyder (D) 92.92% Ed Garner (Independent) 7.08% |
Arkansas 3 | John Boozman | Republican | 2001 | Re-elected | John Boozman (R) 98.90% George "Ozone" Lyne (Independent) 1.10% |
Arkansas 4 | Mike Ross | Democratic | 2000 | Re-elected | Mike Ross (D) 60.56% Jay Dickey (R) 39.44% |
California
The state gained one seat in reapportionment.
| District | Incumbent | Party | First elected | Result | Candidates |
|---|---|---|---|---|---|
California 1 | Mike Thompson | Democratic | 1998 | Re-elected | Mike Thompson (D) 64.07% Lawrence R. Wiesner (R) 32.4% Kevin Bastian (L) 3.53% |
California 2 | Wally Herger | Republican | 1988 | Re-elected | Wally Herger (R) 65.79% Mike Johnson (D) 29.31% Patrice Thiessen (NL) 2.72% Charles R. Martin (L) 2.19% |
California 3 | Doug Ose | Republican | 1998 | Re-elected | Doug Ose (R) 62.45% Howard Beeman (D) 34.44% Douglas Arthur Tuma (L) 3.1% |
California 4 | John Doolittle | Republican | 1990 | Re-elected | John Doolittle (R) 64.77% Mark Norberg (D) 31.89% Allen M. Roberts (L) 3.17% Write-ins 0.17% |
California 5 | Bob Matsui | Democratic | 1978 | Re-elected | Bob Matsui (D) 71.47% Richard Frankhuizen (R) 26.41% Timothy Roloff (L) 3.12% |
California 6 | Lynn Woolsey | Democratic | 1992 | Re-elected | Lynn Woolsey (D) 66.69% Paul L. Erickson (R) 29.61% Richard O. Barton (L) 2.36% Jeff Rainforth (Ref) 1.35% |
California 7 | George Miller | Democratic | 1974 | Re-elected | George Miller (D) 70.71% Charles R. Hargrave (R) 26.44% Scott A. Wilson (L) 2.85% |
California 8 | Nancy Pelosi | Democratic | 1987 | Re-elected | Nancy Pelosi (D) 79.58% G. Michael German (R) 12.5% Jay Pond (G) 6.25% Ira Spivack (L) 1.66% |
California 9 | Barbara Lee | Democratic | 1998 | Re-elected | Barbara Lee (D) 81.41% Jerald Udinsky (R) 15.18% James M. Eyer (L) 3.41% |
California 10 | Ellen Tauscher | Democratic | 1996 | Re-elected | Ellen Tauscher (D) 75.59% Sonia E. Alonso Harden (L) 24.41% |
California 11 | Richard Pombo | Republican | 1992 | Re-elected | Richard Pombo (R) 60.31% Elaine Shaw (D) 39.69% |
California 12 | Tom Lantos | Democratic | 1980 | Re-elected | Tom Lantos (D) 68.13% Michael Moloney (R) 24.76% Maad Abu-Ghazalah (L) 7.1% |
California 13 | Pete Stark | Democratic | 1972 | Re-elected | Pete Stark (D) 71.06% Syed Mahmood (R) 22.06% Mark Stroberg (L) 3.04% Don J. Grundmann (AI) 2.28% John Bambey (Ref) 1.56% |
California 14 | Anna Eshoo | Democratic | 1992 | Re-elected | Anna Eshoo (D) 68.18% Joe Nixon (R) 28.16% Andrew Carver (L) 3.66% |
California 15 | Mike Honda | Democratic | 2000 | Re-elected | Mike Honda (D) 65.77% Linda Rae Hermann (R) 31.01% Jeff Landauer (L) 3.22% |
California 16 | Zoe Lofgren | Democratic | 1994 | Re-elected | Zoe Lofgren (D) 67.02% Douglas Adams McNea (R) 29.8% Dennis Michael Umphress (L) 3.18% |
California 17 | Sam Farr | Democratic | 1993 | Re-elected | Sam Farr (D) 68.07% Clint Engler (R) 27.02% Ray Glock-Grueneich (G) 3.27% Jascha Lee (L) 1.62% |
California 18 | Gary Condit | Democratic | 1989 | Lost renomination Democratic hold | Dennis Cardoza (D) 51.26% Dick Monteith (R) 43.37% Kevin Cripe (AI) 3.32% Linda De Groat (L) 2% |
California 19 | George Radanovich | Republican | 1994 | Re-elected | George Radanovich (R) 67.31% John Veen (D) 30.04% Patrick Lee McHargue (L) 1.66% |
California 20 | Cal Dooley | Democratic | 1990 | Re-elected | Cal Dooley (D) 63.7% Andre Minuth (R) 34.28% Varrin Swearingen (L) 2.03% |
California 21 | None (District created) | New seat Republican gain | Devin Nunes (R) 70.49% David LaPere (D) 26.24% Jonathan Richter (L) 3.28% | ||
California 22 | Bill Thomas Redistricted from the 21st district | Republican | 1978 | Re-elected | Bill Thomas (R) 73.33% Jaime Corvera (D) 23.73% Frank Coates (L) 2.94% |
California 23 | Lois Capps Redistricted from the 22nd district | Democratic | 1998 | Re-elected | Lois Capps (D) 59.03% Beth Rogers (R) 38.59% James Hill (L) 2.38% |
California 24 | Elton Gallegly Redistricted from the 23rd district | Republican | 1986 | Re-elected | Elton Gallegly (R) 65.18% Fern Rudin (D) 31.76% Gary Harber (L) 3.06% |
California 25 | Howard McKeon | Republican | 1992 | Re-elected | Howard McKeon (R) 64.97% Bob Conaway (D) 31.1% Frank Consolo (L) 3.93% |
California 26 | David Dreier Redistricted from the 28th district | Republican | 1980 | Re-elected | David Dreier (R) 63.77% Marjorie Musser Mikels (D) 33.49% Randall Weissbuch (L) 2.73% |
California 27 | Brad Sherman Redistricted from the 24th district | Democratic | 1996 | Re-elected | Brad Sherman (D) 61.96% Robert Levy (R) 38.04% |
California 28 | Howard Berman Redistricted from the 26th district | Democratic | 1982 | Re-elected | Howard Berman (D) 71.4% David Hernandez (R) 23.16% Kelley Ross (L) 5.45% |
California 29 | Adam Schiff Redistricted from the 27th district | Democratic | 2000 | Re-elected | Adam Schiff (D) 62.56% Jim Scileppi (R) 33.42% Ted Brown (L) 4.02% |
California 30 | Henry Waxman Redistricted from the 29th district | Democratic | 1974 | Re-elected | Henry Waxman (D) 70.37% Tony Goss (R) 29.63% |
California 31 | Xavier Becerra Redistricted from the 30th district | Democratic | 1992 | Re-elected | Xavier Becerra (D) 81.15% Luis Vega (R) 18.85% |
California 32 | Hilda Solis Redistricted from the 31st district | Democratic | 2000 | Re-elected | Hilda Solis (D) 68.79% Emma Fischbeck (R) 27.46% Michael McGuire (L) 3.74% |
California 33 | Diane Watson Redistricted from the 32nd district | Democratic | 2001 | Re-elected | Diane Watson (D) 82.55% Andrew Kim (R) 14.1% Charles Tate (L) 3.35% |
California 34 | Lucille Roybal-Allard Redistricted from the 33rd district | Democratic | 1992 | Re-elected | Lucille Roybal-Allard (D) 74.04% Wayne Miller (R) 25.96% |
California 35 | Maxine Waters | Democratic | 1990 | Re-elected | Maxine Waters (D) 77.51% Ross Moen (R) 19.37% Gordon Mego (AI) 3.12% |
California 36 | Jane Harman | Democratic | 1986/2000 | Re-elected | Jane Harman (D) 61.35% Stuart Johnson (R) 35.01% Mark McSpadden (L) 3.63% |
California 37 | Juanita Millender-McDonald | Democratic | 1996 | Re-elected | Juanita Millender-McDonald (D) 72.92% Oscar Velasco (R) 23.16% Herb Peters (L) 3.92% |
California 38 | Grace Napolitano Redistricted from the 34th district | Democratic | 1998 | Re-elected | Grace Napolitano (D) 71.11% Alex Burrola (R) 26.27% Al Cuperus (L) 2.61% |
California 39 | Steve Horn Redistricted from the 38th district | Republican | 1992 | Retired Democratic gain | Linda Sánchez (D) 54.81% Tim Escobar (R) 40.82% Richard Newhouse (L) 4.37% |
California 40 | Ed Royce Redistricted from the 39th district | Republican | 1992 | Re-elected | Ed Royce (R) 67.64% Christina Avalos (D) 29.47% Chuck McGlawn (L) 2.89% |
California 41 | Jerry Lewis Redistricted from the 40th district | Republican | 1978 | Re-elected | Jerry Lewis (R) 67.38% Keith Johnson (D) 29.63% Kevin Craig (L) 2.99% |
California 42 | Gary Miller Redistricted from the 41st district | Republican | 1998 | Re-elected | Gary Miller (R) 67.8% Richard Waldron (D) 28.98% Donald Yee (L) 3.22% |
California 43 | Joe Baca Redistricted from the 42nd district | Democratic | 1999 | Re-elected | Joe Baca (D) 66.39% Wendy Neighbor (R) 30.47% Ethel Mohler (L) 3.14% |
California 44 | Ken Calvert Redistricted from the 43rd district | Republican | 1992 | Re-elected | Ken Calvert (R) 63.66% Louis Vandenberg (D) 31.56% Phill Courtney (G) 4.78% |
California 45 | Mary Bono Redistricted from the 44th district | Republican | 1998 | Re-elected | Mary Bono (R) 65.23% Elle Kurpiewski (D) 32.72% Rod Miller-Boyer (L) 2.05% |
California 46 | Dana Rohrabacher Redistricted from the 45th district | Republican | 1988 | Re-elected | Dana Rohrabacher (R) 61.73% Gerrie Schipske (D) 34.54% Keith Gann (L) 3.68% |
California 47 | Loretta Sanchez Redistricted from the 46th district | Democratic | 1996 | Re-elected | Loretta Sanchez (D) 60.56% Jeff Chavez (R) 34.69% Paul Marsden (L) 4.2% Write-ins 0.55% |
California 48 | Christopher Cox Redistricted from the 47th district | Republican | 1988 | Re-elected | Christopher Cox (R) 68.44% John Graham (D) 28.44% Joe Michael Cobb (L) 3.12% |
California 49 | Darrell Issa Redistricted from the 48th district | Republican | 2000 | Re-elected | Darrell Issa (R) 77.22% Karl Dietrich (L) 21.95% Write-ins 0.83% |
California 50 | Duke Cunningham Redistricted from the 51st district | Republican | 1990 | Re-elected | Duke Cunningham (R) 64.33% Del Stewart (D) 32.34% Richard Fontanesi (L) 3.33% |
California 51 | Bob Filner Redistricted from the 50th district | Democratic | 1992 | Re-elected | Bob Filner (D) 57.93% Maria Garcia (R) 39.33% Jeffrey Keup (L) 2.74% |
California 52 | Duncan Hunter | Republican | 1980 | Re-elected | Duncan Hunter (R) 70.15% Peter Moore-Kochlacs (D) 25.75% Michael Benoit (L) 4.1% |
California 53 | Susan Davis Redistricted from the 49th district | Democratic | 2000 | Re-elected | Susan Davis (D) 62.19% Bill VanDeWeghe (R) 37.78% Write-ins 0.03% |
Colorado
The state gained one seat in reapportionment.
| District | Incumbent | Party | First elected | Result | Candidates |
|---|---|---|---|---|---|
Colorado 1 | Diana DeGette | Democratic | 1996 | Re-elected | Diana DeGette (D) 66.28% Ken Chlouber (R) 29.59% Ken Seaman (G) 1.90% Kent Leonard (L) 1.53% |
Colorado 2 | Mark Udall | Democratic | 1998 | Re-elected | Mark Udall (D) 60.09% Sandy Hume (R) 36.77% Norm Olsen (L) 1.74% |
Colorado 3 | Scott McInnis | Republican | 1992 | Re-elected | Scott McInnis (R) 65.80% Dennis Berckefeldt (D) 31.27% Brent Shroyer (L) 2.00% |
Colorado 4 | Bob Schaffer | Republican | 1996 | Retired Republican hold | Marilyn Musgrave (R) 54.94% Stan Matsunaka (D) 41.68% John Volz (L) 3.38% |
Colorado 5 | Joel Hefley | Republican | 1986 | Re-elected | Joel Hefley (R) 69.37% Curtis Imrie (D) 24.68% Biff Baker (L) 5.94% |
Colorado 6 | Tom Tancredo | Republican | 1998 | Re-elected | Tom Tancredo (R) 66.88% Lance Wright (D) 30.03% Adam Katz (L) 3.08% |
Colorado 7 | None (District created) | New seat Republican gain | Bob Beauprez (R) 47.31% Mike Feeley (D) 47.24% Dave Chandler (G) 1.89% Victor Good (CRP) 1.81% G.T. "Bud" Martin (L) 1.68% | ||
Connecticut
The state lost one seat in reapportionment.
| District | Incumbent | Party | First elected | Result | Candidates |
|---|---|---|---|---|---|
Connecticut 1 | John Larson | Democratic | 1998 | Re-elected | John Larson (D) 66.79% Phil Steele (R) 33.20% |
Connecticut 2 | Rob Simmons | Republican | 2000 | Re-elected | Rob Simmons (R) 54.09% Joseph Courtney (D) 45.91% |
Connecticut 3 | Rosa DeLauro | Democratic | 1990 | Re-elected | Rosa DeLauro (D) 65.58% Richter Elser (R) 29.54% Charles Pillsbury (G) 4.88% |
Connecticut 4 | Chris Shays | Republican | 1987 | Re-elected | Chris Shays (R) 64.43% Stephanie Sanchez (D) 35.57% |
Connecticut 5 | Jim Maloney | Democratic | 1996 | Lost redistricting contest Democratic loss | Nancy Johnson (R) 54.25% Jim Maloney (D) 43.26% Joseph Zdonczyk (CNC) 1.77% Walter Gengarelly (L) 0.72% |
Nancy Johnson Redistricted from the 6th district (now obsolete) | Republican | 1982 | Re-elected |
Delaware
| District | Incumbent | Party | First elected | Result | Candidates |
|---|---|---|---|---|---|
Delaware At-large | Michael N. Castle | Republican | 1992 | Re-elected | Michael N. Castle (R) 72.07% Michael Miller (D) 26.71% Brad C. Thomas (L) 1.22% |
Florida
The state gained two seats in reapportionment.
| District | Incumbent | Party | First elected | Result | Candidates |
|---|---|---|---|---|---|
Florida 1 | Jeff Miller | Republican | 2001 | Re-elected | Jeff Miller (R) 74.59% Bert Oram (D) 25.40% |
Florida 2 | Allen Boyd | Democratic | 1996 | Re-elected | Allen Boyd (D) 66.90% Tom McGurk (R) 33.10% |
Florida 3 | Corrine Brown | Democratic | 1992 | Re-elected | Corrine Brown (D) 59.29% Jennifer Carroll (R) 40.71% |
Florida 4 | Ander Crenshaw | Republican | 2000 | Re-elected | Ander Crenshaw (R) unopposed |
Florida 5 | Karen Thurman | Democratic | 1992 | Lost re-election Republican gain | Ginny Brown-Waite (R) 47.90% Karen Thurman (D) 46.24% Jack Gargan (I) 3.39% Brian Moore (I) 2.44% |
Florida 6 | Cliff Stearns | Republican | 1988 | Re-elected | Cliff Stearns (R) 65.36% David Bruderly (D) 34.64% |
Florida 7 | John Mica | Republican | 1992 | Re-elected | John Mica (R) 59.58% Wayne Hogan (D) 40042% |
Florida 8 | Ric Keller | Republican | 2000 | Re-elected | Ric Keller (R) 65.14% Eddie Diaz (D) 34.86% |
Florida 9 | Michael Bilirakis | Republican | 1982 | Re-elected | Michael Bilirakis (R) 71.46% Chuck Kalogianis (D) 28.53% |
Florida 10 | Bill Young | Republican | 1970 | Re-elected | Bill Young (R) unopposed |
Florida 11 | Jim Davis | Democratic | 1996 | Re-elected | Jim Davis (D) unopposed |
Florida 12 | Adam Putnam | Republican | 2000 | Re-elected | Adam Putnam (R) unopposed |
Florida 13 | Dan Miller | Republican | 1992 | Retired Republican hold | Katherine Harris (R) 54.78% Jan Schneider (D) 45.21% |
Florida 14 | Porter Goss | Republican | 1988 | Re-elected | Porter Goss (R) unopposed |
Florida 15 | Dave Weldon | Republican | 1994 | Re-elected | Dave Weldon (R) 63.15% Jim Tso (D) 36.85% |
Florida 16 | Mark Foley | Republican | 1994 | Re-elected | Mark Foley (R) 78.88% Jack McLain (C) 21.12% |
Florida 17 | Carrie Meek | Democratic | 1992 | Retired Democratic hold | Kendrick Meek (D) unopposed |
Florida 18 | Ileana Ros-Lehtinen | Republican | 1989 | Re-elected | Ileana Ros-Lehtinen (R) 69.11% Ray Chote (D) 28.61% Orin Opperman (I) 2.29% |
Florida 19 | Robert Wexler | Democratic | 1996 | Re-elected | Robert Wexler (D) 72.16% Jack Merkl (R) 27.84% |
Florida 20 | Peter Deutsch | Democratic | 1992 | Re-elected | Peter Deutsch (D) unopposed |
Florida 21 | Lincoln Diaz-Balart | Republican | 1992 | Re-elected | Lincoln Diaz-Balart (R) unopposed |
Florida 22 | Clay Shaw | Republican | 1980 | Re-elected | Clay Shaw (R) 60.77% Carol Roberts (D) 38.35% Juan Xuna (I) 0.88% |
Florida 23 | Alcee Hastings | Democratic | 1992 | Re-elected | Alcee Hastings (D) 77.49% Charles Laurie (R) 22.51% |
Florida 24 | None (District created) | New seat Republican gain | Tom Feeney (R) 61.84% Harry Jacobs (D) 38.16% | ||
Florida 25 | None (District created) | New seat Republican gain | Mario Diaz-Balart (R) 64.65% Annie Betancourt (D) 35.35% | ||
Georgia
The state gained two seats in reapportionment.
| District | Incumbent | Party | First elected | Result | Candidates |
|---|---|---|---|---|---|
Georgia 1 | Jack Kingston | Republican | 1992 | Re-elected | Jack Kingston (R) 72.14% Don Smart (D) 27.86% |
Georgia 2 | Sanford Bishop | Democratic | 1992 | Re-elected | Sanford Bishop (D) unopposed |
Georgia 3 | Saxby Chambliss Redistricted from the 8th district | Republican | 1994 | Retired to run for U.S. Senate Democratic gain | Jim Marshall (D) 50.51% Calder Clay, III (R) 49.49% |
Georgia 4 | Cynthia McKinney | Democratic | 1992 | Lost renomination Democratic hold | Denise Majette (D) 77.03% Cynthia Van Auken (R) 22.97% |
Georgia 5 | John Lewis | Democratic | 1986 | Re-elected | John Lewis (D) unopposed |
Georgia 6 | Johnny Isakson | Republican | 1999 | Re-elected | Johnny Isakson (R) 79.87% Jeff Weisberger (D) 20.13% |
Georgia 7 | John Linder Redistricted from the 11th district | Republican | 1992 | Re-elected | John Linder (R) 78.92% Michael Berlon (D) 21.08% |
Bob Barr Redistricted from the 7th district | Republican | 1994 | Lost redistricting contest Republican loss | ||
Georgia 8 | Mac Collins Redistricted from the 3rd district | Republican | 1992 | Re-elected | Mac Collins (R) 78.33% Angelos Petrakopoulos (D) 21.67% |
Georgia 9 | Charlie Norwood Redistricted from the 10th district | Republican | 1994 | Re-elected | Charlie Norwood (R) 72.84% Barry Gordon Irwin (D) 27.16% |
Georgia 10 | Nathan Deal Redistricted from the 9th district | Republican | 1992 | Re-elected | Nathan Deal (R) unopposed |
Georgia 11 | None (District created) | New seat Republican gain | Phil Gingrey (R) 51.64% Roger Kahn (D) 48.36% | ||
Georgia 12 | None (District created) | New seat Republican gain | Max Burns (R) 55.19% Charles "Champ" Walker (D) 44.81% | ||
Georgia 13 | None (District created) | New seat Democratic gain | David Scott (D) 59.63% Clay Cox (R) 40.37% | ||
Hawaii
| District | Incumbent | Party | First elected | Result | Candidates |
|---|---|---|---|---|---|
Hawaii 1 | Neil Abercrombie | Democratic | 1990 | Re-elected | Neil Abercrombie (D) 72.85% Mark Terry (R) 24.92% James Bracken (L) 2.23% |
Hawaii 2 | Patsy Mink | Democratic | 1964, 1990 | Re-elected (posthumously) | Patsy Mink (D) 56.16% Bob McDermott (R) 39.98% Jeff Mallan (L) 2.63% Nicholas Bedworth (NL) 1.23% |
Idaho
| District | Incumbent | Party | First elected | Result | Candidates |
|---|---|---|---|---|---|
Idaho 1 | Butch Otter | Republican | 2000 | Re-elected | Butch Otter (R) 58.57% Betty Richardson (D) 38.94% Steve Gothard (L) 2.49% |
Idaho 2 | Mike Simpson | Republican | 1998 | Re-elected | Mike Simpson (R) 68.18% Edward Kinghorn (D) 29.05% John "Lack" Lewis (L) 2.77% |
Illinois
The state lost one seat in reapportionment.
| District | Incumbent | Party | First elected | Result | Candidates |
|---|---|---|---|---|---|
Illinois 1 | Bobby Rush | Democratic | 1992 | Re-elected | Bobby Rush (D) 81.17% Raymond Wardingley (R) 16.21% Dorothy Tsatsos (L) 2.62% |
Illinois 2 | Jesse L. Jackson Jr. | Democratic | 1995 | Re-elected | Jesse L. Jackson Jr. (D) 82.30% Doug Nelson (R) 17.70% |
Illinois 3 | Bill Lipinski | Democratic | 1982 | Re-elected | Bill Lipinski (D) unopposed |
Illinois 4 | Luis Gutierrez | Democratic | 1992 | Re-elected | Luis Gutierrez (D) 79.68% Tony Lopez-Cisneros (R) 15.12% Maggie Kohls (L) 5.20% |
Illinois 5 | Rod Blagojevich | Democratic | 1996 | Retired to run for Governor Democratic hold | Rahm Emanuel (D) 66.81% Mark Augusti (R) 28.86% Frank Gonzalez (L) 4.34% |
Illinois 6 | Henry Hyde | Republican | 1974 | Re-elected | Henry Hyde (R) 65.09% Tom Berry (D) 34.91% |
Illinois 7 | Danny K. Davis | Democratic | 1996 | Re-elected | Danny K. Davis (D) 83.21% Mark Tunney (R) 15.25% Martin Pankau (L) 1.53% |
Illinois 8 | Phil Crane | Republican | 1969 | Re-elected | Phil Crane (R) 57.42% Melissa Bean (D) 42.56% |
Illinois 9 | Jan Schakowsky | Democratic | 1998 | Re-elected | Jan Schakowsky (D) 70.27% Nicholas Duric (R) 26.83% Stephanie Sailor (L)2.89% |
Illinois 10 | Mark Kirk | Republican | 2000 | Re-elected | Mark Kirk (R) 68.81% Hank Perritt (D) 31.19% |
Illinois 11 | Jerry Weller | Republican | 1994 | Re-elected | Jerry Weller (R) 64.32% Keith Van Duyne (D) 35.68% |
Illinois 12 | Jerry Costello | Democratic | 1988 | Re-elected | Jerry Costello (D) 69.25% David Sadler (R) 30.75% |
Illinois 13 | Judy Biggert | Republican | 1998 | Re-elected | Judy Biggert (R) 70.26% Thomas Mason (D) 29.74% |
Illinois 14 | Dennis Hastert | Republican | 1986 | Re-elected | Dennis Hastert (R) 74.14% Laurence Quick (D) 25.86% |
Illinois 15 | Timothy V. Johnson | Republican | 2000 | Re-elected | Timothy V. Johnson (R) 65.17% Joshua Hartke (D) 31.04% Carl Estabrook (ILG) 3.79% |
Illinois 16 | Donald A. Manzullo | Republican | 1992 | Re-elected | Donald A. Manzullo (R) 70.61% John Kutsch (D) 29.39% |
Illinois 17 | Lane Evans | Democratic | 1982 | Re-elected | Lane Evans (D) 62.42% Peter Calderone (R) 37.58% |
Illinois 18 | Ray LaHood | Republican | 1994 | Re-elected | Ray LaHood (R) unopposed |
Illinois 19 | John Shimkus Redistricted from the 20th[4] | Republican | 1996 | Re-elected | John Shimkus (R) 54.79% David D. Phelps (D) 45.21% |
David D. Phelps | Democratic | 1998 | Lost redistricting contest Democratic loss |
Indiana
The state lost one seat in reapportionment.
| District | Incumbent | Party | First elected | Result | Candidates |
|---|---|---|---|---|---|
Indiana 1 | Pete Visclosky | Democratic | 1984 | Re-elected | Pete Visclosky (D) 66.94% Mark Leyva (R) 31.02% Timothy Brennan (L) 2.04% |
Indiana 2 | Tim Roemer Redistricted from the 3rd district | Democratic | 1990 | Retired Republican gain | Chris Chocola (R) 50.45% Jill Long Thompson (D) 45.77% Sharon Metheny (L) 3.77% |
Indiana 3 | Mark Souder Redistricted from the 4th district | Republican | 1994 | Re-elected | Mark Souder (R) 63.14% Jay Rigdon (D) 34.45% Mike Donlan (L) 2.41% |
Indiana 4 | Steve Buyer Redistricted from the 5th district | Republican | 1992 | Re-elected | Steve Buyer (R) 71.36% Bill Abbott (D) 26.15% Jerry Susong (L) 2.49% |
Brian D. Kerns Redistricted from the 7th district | Republican | 2000 | Lost redistricting contest Republican loss | ||
Indiana 5 | Dan Burton Redistricted from the 6th district | Republican | 1982 | Re-elected | Dan Burton (R) 71.97% Katherine Fox Carr (D) 25.18% Christopher Adkins (L) 2.85% |
Indiana 6 | Mike Pence Redistricted from the 2nd district | Republican | 2000 | Re-elected | Mike Pence (R) 63.79% Mel Fox (D) 34.40% Doris Robertson (L) 1.80% |
Indiana 7 | Julia Carson Redistricted from the 10th district (now obsolete) | Democratic | 1996 | Re-elected | Julia Carson (D) 53.13% Brose McVey (R) 44.14% Andrew Horning (L) 2.69% |
Indiana 8 | John Hostettler | Republican | 1994 | Re-elected | John Hostettler (R) 51.31% Bryan Hartke (D) 46.02% Pam Williams (L) 2.67% |
Indiana 9 | Baron Hill | Democratic | 1998 | Re-elected | Baron Hill (D) 51.15% Mike Sodrel (R) 46.13% Jeff Melton (G) 1.45% Al Cox (L) 1.26% |
Iowa
| District | Incumbent | Party | First elected | Result | Candidates |
|---|---|---|---|---|---|
Iowa 1 | Jim Nussle Redistricted from the 2nd district | Republican | 1990 | Re-elected | Jim Nussle (R) 57.15% Ann Hutchinson (D) 42.65% |
Iowa 2 | Jim Leach Redistricted from the 1st district | Republican | 1976 | Re-elected | Jim Leach (R) 52.19% Julie Thomas (D) 45.74% Kevin Litten (L) 2.02% |
Iowa 3 | Leonard Boswell | Democratic | 1996 | Re-elected | Leonard Boswell (D) 53.41% Stan Thompson (R) 45.04% Jeffrey Smith (L) 1.24% |
Iowa 4 | Tom Latham Redistricted from the 5th district | Republican | 1994 | Re-elected | Tom Latham (R) 54.76% John Norris (D) 43.07% Terry Wilson (L) 1.40% Jim Hennager (L) 0.73% |
Iowa 5 | Greg Ganske Redistricted from the 4th district | Republican | 1994 | Retired to run for U.S. Senate Republican hold | Steve King (R) 62.15% Paul Shomshor (D) 37.78% |
Kansas
| District | Incumbent | Party | First elected | Result | Candidatess |
|---|---|---|---|---|---|
Kansas 1 | Jerry Moran | Republican | 1996 | Re-elected | Jerry Moran (R) 91.09% Jack Warner (L) 8.91% |
Kansas 2 | Jim Ryun | Republican | 1996 | Re-elected | Jim Ryun (R) 60.42% Dan Lykins (D) 37.52% Art Clack (L) 2.06% |
Kansas 3 | Dennis Moore | Democratic | 1998 | Re-elected | Dennis Moore (D) 50.18% Adam Taff (R) 46.89% Dawn Bly (Ref.) 2.30% Douglas Martin (L) 0.62% |
Kansas 4 | Todd Tiahrt | Republican | 1994 | Re-elected | Todd Tiahrt (R) 60.58% Carlos Nolla (D) 37.00% Maike Warren (L) 2.42% |
Kentucky
| District | Incumbent | Party | First elected | Result | Candidatess |
|---|---|---|---|---|---|
Kentucky 1 | Ed Whitfield | Republican | 1994 | Re-elected | Ed Whitfield (R) 62.25% Klint Alexander (D) 34.75% |
Kentucky 2 | Ron Lewis | Republican | 1994 | Re-elected | Ron Lewis (R) 69.64% David L. Williams (D) 29.17% Robert Guy Dyer (L) 1.18% |
Kentucky 3 | Anne Northup | Republican | 1996 | Re-elected | Anne Northup (R) 51.61% Jack Conway (D) 48.39% |
Kentucky 4 | Ken Lucas | Democratic | 1998 | Re-elected | Ken Lucas (D) 51.11% Geoff Davis (R) 47.54% John Grote (L) 1.34% |
Kentucky 5 | Hal Rogers | Republican | 1980 | Re-elected | Hal Rogers (R) 78.29% Sidney Jane Bailey (D) 21.71% |
Kentucky 6 | Ernie Fletcher | Republican | 1998 | Re-elected | Ernie Fletcher (R) 71.95% Gatewood Galbraith (I) 25.98% Mark Gailey (L) 2.06% |
Louisiana
| District | Incumbent | Party | First elected | Result | Candidates |
|---|---|---|---|---|---|
Louisiana 1 | David Vitter | Republican | 1999 | Re-elected | David Vitter (R) 81.47% Monica Monica (R) 11.22% Robert Namer (R) 4.00% Ian Hawxhurst (I) 3.30% |
Louisiana 2 | William J. Jefferson | Democratic | 1990 | Re-elected | William J. Jefferson (D) 63.53% Irma Muse Dixon (D) 20.03% Silky Sullivan (R) 10.86% Clarence "Buddy" Hunt (D) 2.91% Wayne Clement (I) 2.67% |
Louisiana 3 | Billy Tauzin | Republican | 1980 | Re-elected | Billy Tauzin (R) 86.68% William Beier (O) 8.62% David Iwancio (I) 4.69% |
Louisiana 4 | Jim McCrery | Republican | 1988 | Re-elected | Jim McCrery (R) 71.61% John Milkovich (D) 26.45% Bill Jacobs (I) 1.94% |
Louisiana 5 | John Cooksey | Republican | 1996 | Retired to run for Senate Democratic gain | Rodney Alexander (D) 50.28% Lee Fletcher (R) 49.72% |
Louisiana 6 | Richard Baker | Republican | 1986 | Re-elected | Richard Baker (R) 84.04% Rick Moscatello (I) 15.96% |
Louisiana 7 | Chris John | Democratic | 1996 | Re-elected | Chris John (D) 86.82% Michael Harris (I) 13.18% |
Maine
| District | Incumbent | Party | First elected | Result | Candidates |
|---|---|---|---|---|---|
Maine 1 | Tom Allen | Democratic | 1996 | Re-elected | Tom Allen (D) 63.81% Steven Joyce (R) 36.19% |
Maine 2 | John Baldacci | Democratic | 1994 | Retired to run for Governor Democratic hold | Michael Michaud (D) 52.01% Kevin Raye (R) 47.99% |
Maryland
| District | Incumbent | Party | First elected | Result | Candidates |
|---|---|---|---|---|---|
Maryland 1 | Wayne Gilchrest | Republican | 1990 | Re-elected | Wayne Gilchrest (R) 76.67% Ann Tamlyn (D) 23.16% |
Maryland 2 | Robert Ehrlich | Republican | 1994 | Retired to run for Governor Democratic gain | Dutch Ruppersberger (D) 54.16% Helen Delich Bentley (R) 45.57% |
Maryland 3 | Ben Cardin | Democratic | 1986 | Re-elected | Ben Cardin (D) 65.72% Scott Conwell (R) 34.18% |
Maryland 4 | Albert Wynn | Democratic | 1992 | Re-elected | Albert Wynn (D) 78.57% John Kimble (R) 20.82% |
Maryland 5 | Steny Hoyer | Democratic | 1981 | Re-elected | Steny Hoyer (D) 69.27% Joseph Crawford (R) 30.52% |
Maryland 6 | Roscoe Bartlett | Republican | 1992 | Re-elected | Roscoe Bartlett (R) 66.11% Donald DeArmon (D) 33.80% |
Maryland 7 | Elijah Cummings | Democratic | 1996 | Re-elected | Elijah Cummings (D) 73.53% Joseph Ward (R) 26.38% |
Maryland 8 | Connie Morella | Republican | 1986 | Lost re-election Democratic gain | Chris Van Hollen (D) 51.71% Connie Morella (R) 47.49% Stephen Bassett (UN) 0.73% |
Massachusetts
| District | Incumbent | Party | First elected | Result | Candidates |
|---|---|---|---|---|---|
Massachusetts 1 | John Olver | Democratic | 1991 | Re-elected | John Olver (D) 67.56% Matthew Kinnaman (R) 32.38% |
Massachusetts 2 | Richard Neal | Democratic | 1988 | Re-elected | Richard Neal (D) unopposed |
Massachusetts 3 | Jim McGovern | Democratic | 1996 | Re-elected | Jim McGovern (D) unopposed |
Massachusetts 4 | Barney Frank | Democratic | 1980 | Re-elected | Barney Frank (D) unopposed |
Massachusetts 5 | Marty Meehan | Democratic | 1992 | Re-elected | Marty Meehan (D) 60.15% Charles McCarthy (R) 34.03% Ilana Freedman (L) 5.76% |
Massachusetts 6 | John F. Tierney | Democratic | 1996 | Re-elected | John F. Tierney (D) 68.27% Mark C. Smith (R) 31.63% |
Massachusetts 7 | Ed Markey | Democratic | 1976 | Re-elected | Ed Markey (D) unopposed |
Massachusetts 8 | Mike Capuano | Democratic | 1998 | Re-elected | Mike Capuano (D) unopposed |
Massachusetts 9 | Stephen Lynch | Democratic | 2001 | Re-elected | Stephen Lynch (D) unopposed |
Massachusetts 10 | Bill Delahunt | Democratic | 1996 | Re-elected | Bill Delahunt (D) 69.20% Luis Gonzaga (R) 30.74% |
Michigan
The state lost one seat in reapportionment.
| District | Incumbent | Party | First elected | Result | Candidates |
|---|---|---|---|---|---|
Michigan 1 | Bart Stupak | Democratic | 1992 | Re-elected | Bart Stupak (D) 67.67% Don Hooper (R) 31.10% John Loosemore (L) 1.23% |
Michigan 2 | Pete Hoekstra | Republican | 1992 | Re-elected | Pete Hoekstra (R) 70.40% Jeffrey Wrisley (D) 27.70% Laurie Aleck (L) 1.20% |
Michigan 3 | Vern Ehlers | Republican | 1993 | Re-elected | Vern Ehlers (R) 69.97% Kathryn Lynnes (D) 28.32% Tom Quinn (L) 1.19% Richard Lucey (Ref) 0.51% |
Michigan 4 | Dave Camp | Republican | 1990 | Re-elected | Dave Camp (R) 68.21% Lawrence Hollenbeck (D) 30.17% Sterling Johnson (G) 1.03% Al Chia, Jr. (L) 0.58% |
Michigan 5 | James Barcia | Democratic | 1992 | Retired to run for State Senate Democratic loss | Dale Kildee (D) 91.56% Clint Foster (L) 5.39% Harley Mikkelson (G) 2.99% |
Dale Kildee Redistricted from the 9th district | Democratic | 1976 | Re-elected | ||
Michigan 6 | Fred Upton | Republican | 1986 | Re-elected | Fred Upton (R) 69.17% Gary Giguere, Jr. (D) 29.31% Harley Mikkelson (Ref) 1.52% |
Michigan 7 | Nick Smith | Republican | 1992 | Re-elected | Nick Smith (R) 59.66% Mike Simpson (D) 38.61% Ken Proctor (L) 1.73% |
Michigan 8 | Mike Rogers | Republican | 2000 | Re-elected | Mike Rogers (R) 67.88% Frank McAlpine (D) 30.75% Thomas Yeutter (L) 1.37% |
Michigan 9 | Joe Knollenberg Redistricted from the 11th district | Republican | 1992 | Re-elected | Joe Knollenberg (R) 58.10% David Fink (D) 39.88% Robert Schubring (L) 2.03% |
Michigan 10 | David Bonior | Democratic | 1976 | Retired to run for Governor Republican gain | Candice Miller (R) 63.31% Carl Marlinga (D) 35.52% Renae Coon (D) 1.17% |
Michigan 11 | None (District created) | New seat Republican gain | Thad McCotter (R) 57.19% Kevin Kelley (D) 39.66% William Boyd (G) 1.93% Dan Malone (UST) 1.23% | ||
Michigan 12 | Sander Levin | Democratic | 1982 | Re-elected | Sander Levin (D) 68.26% Harvey Dean (R) 29.78% Dick Gach (L) 1.30% Steven Revis (UST) 0.66% |
Michigan 13 | Carolyn Kilpatrick Redistricted from the 15th district | Democratic | 1996 | Re-elected | Carolyn Kilpatrick (D) 91.61% Raymond Warner (R) 8.39% |
Michigan 14 | John Conyers Jr. | Democratic | 1964 | Re-elected | John Conyers Jr. (D) 83.21% Dave Stone (R) 15.20% Francis Schorr (L) 0.88% John Litle (G) 0.71% |
Michigan 15 | John Dingell Redistricted from the 16th district (now obsolete) | Democratic | 1955 | Re-elected | John Dingell (D) 72.21% Martin Kaltenbach (R) 25.72% Gregory Stempfle (L) 2.07% |
Lynn Rivers Redistricted from the 13th district | Democratic | 1994 | Lost redistricting contest Democratic loss | ||
Minnesota
| District | Incumbent | Party | First elected | Result | Candidatess |
|---|---|---|---|---|---|
Minnesota 1 | Gil Gutknecht | Republican | 1994 | Re-elected | Gil Gutknecht (R) 61.50% Steve Andreasen (DFL) 34.65% Greg Mikkelson (G) 3.75% |
Minnesota 2 | Bill Luther Redistricted from the 6th district | Democratic | 1994 | Lost re-election Republican gain | John Kline (R) 53.33% Bill Luther (DFL) 42.22% Greg Mikkelson (NNT) 4.33% |
Minnesota 3 | Jim Ramstad | Republican | 1990 | Re-elected | Jim Ramstad (R) 72.02% Darryl Stanton (DFL) 27.88% |
Minnesota 4 | Betty McCollum | Democratic | 2000 | Re-elected | Betty McCollum (DFL) 62.22% Clyde Billington (R) 33.91% Scott Raskiewicz (G) 3.75% |
Minnesota 5 | Martin Sabo | Democratic | 1978 | Re-elected | Martin Sabo (DFL) 67.03% Daniel Mathias (R) 25.89% Tim Davis (G) 6.96% |
Minnesota 6 | Mark Kennedy Redistricted from the 2nd district | Republican | 2000 | Re-elected | Mark Kennedy (R) 57.34% Janet Robert (DFL) 35.06% Dan Becker (Ind) 7.48% |
Minnesota 7 | Collin Peterson | Democratic | 1990 | Re-elected | Collin Peterson (DFL) 65.27% Dan Stevens (R) 34.64% |
Minnesota 8 | Jim Oberstar | Democratic | 1974 | Re-elected | Jim Oberstar (DFL) 68.65% Bob Lemen (R) 31.23% |
Mississippi
The state lost one seat in reapportionment.
| District | Incumbent | Party | First elected | Result | Candidates |
|---|---|---|---|---|---|
Mississippi 1 | Roger Wicker | Republican | 1994 | Re-elected | Roger Wicker (R) 71.43% Rex Weathers (D) 24.20% Brenda Blackburn (Ref) 2.60% Harold Taylor (L) 1.77% |
Mississippi 2 | Bennie Thompson | Democratic | 1993 | Re-elected | Bennie Thompson (D) 55.14% Clinton LeSueur (R) 42.75% Lee Dilworth (Ref) 2.10% |
Mississippi 3 | Chip Pickering | Republican | 1996 | Re-elected | Chip Pickering (R) 63.76% Ronnie Shows (D) 34.76% Jim Giles (I) 0.65% Harvey Darden (I) 0.43% Brad McDonald (L) 0.35% Carroll Grantham (Ref) 0.23% |
Ronnie Shows Redistricted from the 4th district | Democratic | 1998 | Lost redistricting contest Democratic loss | ||
Mississippi 4 | Gene Taylor Redistricted from the 5th district (now obsolete) | Democratic | 1989 | Re-elected | Gene Taylor (D) 75.21% Karl Mertz (R) 21.24% Wayne Parker (L) 2.05% Thomas Huffmaster (Ref) 1.51% |
Missouri
| District | Incumbent | Party | First elected | Result | Candidates |
|---|---|---|---|---|---|
Missouri 1 | William Lacy Clay | Democratic | 1968 | Re-elected | William Lacy Clay (D) 70.11% Richard Schwadron (R) 27.09% Jim Higgins (L) 2.80% |
Missouri 2 | Todd Akin | Republican | 2000 | Re-elected | Todd Akin (R) 67.14% John Hogan (D) 31.03% Darla Maloney (L) 1.83% |
Missouri 3 | Dick Gephardt | Democratic | 1976 | Re-elected | Dick Gephardt (D) 59.06% Catherine Enz (R) 38.94% Dan Byington (L) 2.00% |
Missouri 4 | Ike Skelton | Democratic | 1976 | Re-elected | Ike Skelton (D) 67.64% Jim Noland (R) 30.66% Daniel Roy Nelson (L) 1.70% |
Missouri 5 | Karen McCarthy | Democratic | 1994 | Re-elected | Karen McCarthy (D) 65.88% Steve Gordon (R) 32.36% Jeanne Bojarski (L) 1.76% |
Missouri 6 | Sam Graves | Republican | 2000 | Re-elected | Sam Graves (R) 63.03% Cathy Rinehart (D) 35.18% Erik Buck (L) 1.79% |
Missouri 7 | Roy Blunt | Republican | 1996 | Re-elected | Roy Blunt (R) 74.81% Ron Lapham (D) 23.00% Doug Burlison (L) 2.19% |
Missouri 8 | Jo Ann Emerson | Republican | 1996 | Re-elected | Jo Ann Emerson (R) 71.76% Gene Curtis (D) 26.91% Eric Van Oostrom (L) 1.32% |
Missouri 9 | Kenny Hulshof | Republican | 1996 | Re-elected | Kenny Hulshof (R) 68.20% Don Deichman (D) 28.55% Keith Brekhus (G) 1.99% John Mruzik (L) 1.26% |
Montana
| District | Incumbent | Party | First elected | Result | Candidates |
|---|---|---|---|---|---|
Montana At-large | Dennis Rehberg | Republican | 2000 | Re-elected | Dennis Rehberg (R) 64.62% Steve Kelly (D) 32.67% Mike Fellows (L) 2.71% |
Nebraska
| District | Incumbent | Party | First elected | Result | Candidates |
|---|---|---|---|---|---|
Nebraska 1 | Doug Bereuter | Republican | 1978 | Re-elected | Doug Bereuter (R) 85.35% Robert Eckerson (L) 14.65% |
Nebraska 2 | Lee Terry | Republican | 1998 | Re-elected | Lee Terry (R) 63.32% Jim Simon (D) 32.98% Doug Paterson (G) 2.28% Dave Stock (L) 1.42% |
Nebraska 3 | Tom Osborne | Republican | 2000 | Re-elected | Tom Osborne (R) 93.17% Jerry Hickman (L) 6.83% |
Nevada
| District | Incumbent | Party | First elected | Result | Candidates |
|---|---|---|---|---|---|
Nevada 1 | Shelley Berkley | Democratic | 1998 | Re-elected | Shelley Berkley (D) 53.72% Lynette Boggs-McDonald (R) 42.73% Steven "Capt. Truth" Dempsey (IAP) 2.39% W. Lane Startin (G) 1.16% |
Nevada 2 | Jim Gibbons | Republican | 1996 | Re-elected | Jim Gibbons (R) 74.3% Travis Souza (D) 19.97% Janine Hansen (IAP) 3.60% Brendan Trainor (L) 1.70% Robert Winquist (NL) 0.39% |
Nevada 3 | None (District created) | New seat Republican gain | Jon Porter (R) 56.08% Dario Herrera (D) 37.24% Pete O'Neil (I) 3.82% Neil Scott (L) 1.91% Richard Odell (IAP) 0.95% | ||
New Hampshire
| District | Incumbent | Party | First elected | Result | Candidates |
|---|---|---|---|---|---|
New Hampshire 1 | John Sununu | Republican | 1996 | Retired to run for U.S. Senate Republican hold | Jeb Bradley (R) 58.11% Martha Fuller Clark (D) 38.48% Dan Belforti (L) 3.33% |
New Hampshire 2 | Charlie Bass | Republican | 1994 | Re-elected | Charlie Bass (R) 56.81% Katrina Swett (D) 40.86% Rosalie Babiarz (L) 2.28% |
New Jersey
| District | Incumbent | Party | First elected | Result | Candidates |
|---|---|---|---|---|---|
New Jersey 1 | Rob Andrews | Democratic | 1990 | Re-elected | Rob Andrews (D) 92.74% Timothy Haas (L) 7.26% |
New Jersey 2 | Frank LoBiondo | Republican | 1994 | Re-elected | Frank LoBiondo (R) 69.21% Steven Farkas (D) 28.28% Roger Merle (G) 1.03% Michael Matthews, Jr. (L) 1.02% Constantino Rozzo (S) 0.46% |
New Jersey 3 | Jim Saxton | Republican | 1984 | Re-elected | Jim Saxton (R) 65.02% Richard Strada (D) 33.92% Raymond Byrne (L) 0.70% Ken Feduniewicz (AF) 0.35% |
New Jersey 4 | Chris Smith | Republican | 1980 | Re-elected | Chris Smith (R) 66.15% Mary Brennan (D) 32.11% Keith Quarles (L) 0.69% Hermann Winkelmann (HHD)0.61% Don Graham (NJC) 0.44% |
New Jersey 5 | Marge Roukema | Republican | 1980 | Retired Republican hold | Scott Garrett (R) 59.48% Anne Sumers (D) 38.28% Michael Cino (LTI) 2.23% |
New Jersey 6 | Frank Pallone | Democratic | 1988 | Re-elected | Frank Pallone (D) 66.46% Ric Medrow (R) 30.89% Richard Strong (G) 1.32% Barry Allen (L) 0.88% Mac Dara Francis X. Lyden (HRA) 0.45% |
New Jersey 7 | Mike Ferguson | Republican | 2000 | Re-elected | Mike Ferguson (R) 57.95% Tim Carden (D) 40.92% Darren Young (L) 1.13% |
New Jersey 8 | Bill Pascrell | Democratic | 1996 | Re-elected | Bill Pascrell (D) 66.83% Jared Silverman (R) 30.59% Joseph Fortunato (G) 2.58% |
New Jersey 9 | Steve Rothman | Democratic | 1996 | Re-elected | Steve Rothman (D) 69.76% Joseph Glass (R) 30.24% |
New Jersey 10 | Don Payne | Democratic | 1988 | Re-elected | Don Payne (D) 84.45% Andrew Wirtz (R) 15.55% |
New Jersey 11 | Rodney Frelinghuysen | Republican | 1994 | Re-elected | Rodney Frelinghuysen (R) 72.38% Vij Pawar (D) 26.39% Richard S. Roth (L) 1.23% |
New Jersey 12 | Rush D. Holt, Jr. | Democratic | 1998 | Re-elected | Rush D. Holt, Jr. (D) 61.04% Buster Soaries (R) 36.65% Carl Mayer (G) 1.09% Thomas Abrams (L) 0.73% Karen Anne Zaletel (NJC) 0.49% |
New Jersey 13 | Bob Menendez | Democratic | 1992 | Re-elected | Bob Menendez (D) 78.30% James Geron (R) 18.17% Pat Henry Faulkner (G) 1.29% Esmat Zaklama (AM, AC) 0.83% Dick Hester (PLC) 0.79% Herbert H. Shaw (PC) 0.62% |
New Mexico
| District | Incumbent | Party | First elected | Result | Candidates |
|---|---|---|---|---|---|
New Mexico 1 | Heather Wilson | Republican | 1998 | Re-elected | Heather Wilson (R) 55.34% Richard Romero (D) 44.66% |
New Mexico 2 | Joe Skeen | Republican | 1980 | Retired Republican hold | Steve Pearce (R) 56.23% John Arthur Smith (D) 43.72% |
New Mexico 3 | Tom Udall | Democratic | 1998 | Re-elected | Tom Udall (D) unopposed |
New York
The state lost two seats in reapportionment.
| District | Incumbent | Party | First elected | Result | Candidates |
|---|---|---|---|---|---|
New York 1 | Felix Grucci | Republican | 2000 | Lost re-election Democratic gain | Tim Bishop (D) 50.23% Felix Grucci (R) 48.59% Lorna Salzman (G) 1.19% |
New York 2 | Steve Israel | Democratic | 2000 | Re-elected | Steve Israel (D) 58.48% Joseph Finley (R) 40.46% John Keenan (G) 1.07% |
New York 3 | Peter King | Republican | 1992 | Re-elected | Peter King (R) 71.88% Stuart Finz (D) 27.22% Janeen DePrima (Lib) 0.89% |
New York 4 | Carolyn McCarthy | Democratic | 1996 | Re-elected | Carolyn McCarthy (D) 56.25% Marilyn F. O'Grady (R) 43.24% Tim Derham (G) 0.51% |
New York 5 | Gary Ackerman | Democratic | 1983 | Re-elected | Gary Ackerman (D) 68% Perry Reich (Con) 7.68% |
New York 6 | Gregory W. Meeks | Democratic | 1998 | Re-elected | Gregory W. Meeks (D) 96.51% Rey Clarke (Ind) 3.49% |
New York 7 | Joseph Crowley | Democratic | 1998 | Re-elected | Joseph Crowley (D) 73.29% Kevin Brawley (R) 26.71% |
New York 8 | Jerrold Nadler | Democratic | 1992 | Re-elected | Jerrold Nadler (D) 76.07% Jim Farrin (R) 18.48% Alan Jay Gerber (Con) 3.16% Dan Wentzel (G) 1.80% Joseph Dobrian (L) 0.49% |
New York 9 | Anthony Weiner | Democratic | 1998 | Re-elected | Anthony Weiner (D) 65.71% Alfred Donohue (R) 34.29% |
New York 10 | Ed Towns | Democratic | 1982 | Re-elected | Ed Towns (D) 97.83% Herbert Ryan (R) 2.17% |
New York 11 | Major Owens | Democratic | 1982 | Re-elected | Major Owens (D) 86.56% Susan Cleary (R) 12.55% Alice Gaffney (Con) 0.90% |
New York 12 | Nydia Velazquez | Democratic | 1992 | Re-elected | Nydia Velazquez (D) 95.81% Cesar Estevez (R) 4.19% |
New York 13 | Vito Fossella | Republican | 1997 | Re-elected | Vito Fossella (R) 69.63% Arne Mattsson (D) 28.32% Anita Lerman (Ind) 1.38% Henry Bardel (G) 0.67% |
New York 14 | Carolyn Maloney | Democratic | 1992 | Re-elected | Carolyn Maloney (D) 75.25% Anton Srdanovic (R) 24.75% |
New York 15 | Charles B. Rangel | Democratic | 1970 | Re-elected | Charles B. Rangel (D) 88.46% Jessie Fields (R) 11.54% |
New York 16 | Jose Serrano | Democratic | 1990 | Re-elected | Jose Serrano (D) 92.07% Frank Dellavalle (R) 7.93% |
New York 17 | Eliot Engel | Democratic | 1988 | Re-elected | Eliot Engel (D) 62.61% Scott Vanderhoef (R) 34.43% Arthur Gallagher (RTL) 1% Elizabeth Shanklin (G) 1.41% |
New York 18 | Nita Lowey | Democratic | 1988 | Re-elected | Nita Lowey (D) 92.04% Michael J. Reynolds (RTL) 7.96% |
New York 19 | Sue Kelly | Republican | 1994 | Re-elected | Sue Kelly (R) 69.97% Janine Selendy (D) 25.98% Christine Tighe (RTL) 2.53% Jonathan Wright (G) 1.53% |
Benjamin A. Gilman Redistricted from the 20th district | Republican | 1972 | Retired Republican loss | ||
New York 20 | John Sweeney Redistricted from the 22nd district | Republican | 1998 | Re-elected | John Sweeney (R) 73.32% Frank Stoppenbach (D) 23.98% Margaret Lewis (G) 2.70% |
New York 21 | Mike McNulty | Democratic | 1988 | Re-elected | Mike McNulty (D) 75.09% Charles Rosenstein (R) 24.91% |
New York 22 | Maurice Hinchey Redistricted from the 26th district | Democratic | 1992 | Re-elected | Maurice Hinchey (D) 64.19% Eric Hall (R) 32.87% Steven Greenfield (G) 1.54% Paul Laux (RTL) 1.40% |
New York 23 | John McHugh Redistricted from the 24th district | Republican | 1992 | Re-elected | John McHugh (R) unopposed |
New York 24 | Sherwood Boehlert Redistricted from the 23rd district | Republican | 1982 | Re-elected | Sherwood Boehlert (R) 70.70% David Walrath (Con) 21.59% Mark Dunau (G) 4.36% Kathleen Peters (RTL) 3.34% |
New York 25 | Jim Walsh | Republican | 1988 | Re-elected | Jim Walsh (R) 72.29% Stephanie Aldersley (D) 26.64% Francis Gavin (G) 1.07% |
New York 26 | Tom Reynolds Redistricted from the 27th district | Republican | 1998 | Re-elected | Tom Reynolds (R) 73.63% Ayesha Nariman (D) 22.42% Shawn Harris (RTL) 2.23% Paul Fallon (G) 1.71% |
New York 27 | Jack Quinn Redistricted from the 30th district (now obsolete) | Republican | 1992 | Re-elected | Jack Quinn (R) 69.06% Peter Crotty (D) 27.49% Thomas Casey (RTL) 2.06% Albert LaBruna (G) 1.38% |
New York 28 | Louise Slaughter | Democratic | 1986 | Re-elected | Louise Slaughter (D) 62.46% Henry Wojtaszek (R) 37.54% |
John LaFalce Redistricted from the 29th district | Democratic | 1974 | Retired Democratic loss | ||
New York 29 | Amo Houghton Redistricted from the 31st district (now obsolete) | Republican | 1986 | Re-elected | Amo Houghton (R) 73.10% Kisun Peters (D) 21.26% Wendy Johnson (RTL) 3.34% Rachel Treichler (G) 2.30% |
North Carolina
The state gained one seat in reapportionment.
| District | Incumbent | Party | First elected | Result | Candidates |
|---|---|---|---|---|---|
North Carolina 1 | Eva Clayton | Democratic | 1992 | Retired Democratic hold | Frank Ballance (D) 63.74% Greg Dority (R) 34.83% Mike Ruff (L) 1.43% |
North Carolina 2 | Bob Etheridge | Democratic | 1996 | Re-elected | Bob Etheridge (D) 65.36% Joseph Ellen (R) 33.27% Gary Minter (L) 1.37% |
North Carolina 3 | Walter Jones Jr. | Republican | 1994 | Re-elected | Walter Jones Jr. (R) 90.70% Gary Goodson (L) 9.30% |
North Carolina 4 | David Price | Democratic | 1986, 1996 | Re-elected | David Price (D) 61.18% Tuan Nguyen (R) 36.15% Ken Nelson (L) 2.67% |
North Carolina 5 | Richard Burr | Republican | 1994 | Re-elected | Richard Burr (R) 70.19% David Crawford (D) 29.81% |
North Carolina 6 | Howard Coble | Republican | 1984 | Re-elected | Howard Coble (R) 90.41% Tara Grubb (L) 9.59% |
North Carolina 7 | Mike McIntyre | Democratic | 1996 | Re-elected | Mike McIntyre (D) 71.13% James Adams (R) 27.32% David Michael Brooks (L) 1.54% |
North Carolina 8 | Robin Hayes | Republican | 1998 | Re-elected | Robin Hayes (R) 53.63% Chris Kouri (D) 44.62% Mark Andrew Johnson (L) 1.75% |
North Carolina 9 | Sue Myrick | Republican | 1994 | Re-elected | Sue Myrick (R) 72.42% Ed McGuire (D) 25.83% Christopher Cole (L) 1.74% |
North Carolina 10 | Cass Ballenger | Republican | 1986 | Re-elected | Cass Ballenger (R) 59.30% Ron Daugherty (D) 37.85% Christopher M. Hill (L) 2.85% |
North Carolina 11 | Charles Taylor | Republican | 1990 | Re-elected | Charles Taylor (R) 55.54% Sam Neill (D) 42.85% Eric Henry (L) 1.61% |
North Carolina 12 | Mel Watt | Democratic | 1992 | Re-elected | Mel Watt (D) 65.34% Jeff Kish (R) 32.79% Carey Head (L) 1.98% |
North Carolina 13 | None (District created) | New seat Democratic gain | Brad Miller (D) 54.72% Carolyn Grant (R) 42.39% Alex MacDonald (L) 2.89% | ||
North Dakota
| District | Incumbent | Party | First elected | Result | Candidates |
|---|---|---|---|---|---|
North Dakota At-large | Earl Pomeroy | Democratic-NPL | 1992 | Re-elected | Earl Pomeroy (D-NPL) 52.41% Rick Clayburgh (R) 47.59% |
Ohio
The state lost one seat in reapportionment.
| District | Incumbent | Party | First elected | Result | Candidates |
|---|---|---|---|---|---|
Ohio 1 | Steve Chabot | Republican | 1994 | Re-elected | Steve Chabot (R) 64.80% Greg Harris (D) 35.20% |
Ohio 2 | Rob Portman | Republican | 1993 | Re-elected | Rob Portman (R) 74.05% Charles W. Sanders (D) 25.95% |
Ohio 3 | Tony P. Hall | Democratic | 1978 | Retired Republican gain | Mike Turner (R) 58.77% Richard Carne (D) 41.22% |
Ohio 4 | Mike Oxley | Republican | 1981 | Re-elected | Mike Oxley (R) 67.52% Jim Clark (D) 32.48% |
Ohio 5 | Paul Gillmor | Republican | 1988 | Re-elected | Paul Gillmor (R) 67.08% Roger C. Anderson (D) 27.55% John Green (I) 5.36% |
Ohio 6 | Ted Strickland | Democratic | 1992 | Re-elected | Ted Strickland (D) 59.48% Mike Halleck (R) 40.52% |
Ohio 7 | Dave Hobson | Republican | 1990 | Re-elected | Dave Hobson (R) 67.56% Kara Anastasio (D) 27.18% Frank Doden (I) 5.26% |
Ohio 8 | John Boehner | Republican | 1990 | Re-elected | John Boehner (R) 70.81% Jeff Hardenbrook (D) 29.19% |
Ohio 9 | Marcy Kaptur | Democratic | 1982 | Re-elected | Marcy Kaptur (D) 73.99% Ed Emery (R) 26.01% |
Ohio 10 | Dennis Kucinich | Democratic | 1996 | Re-elected | Dennis Kucinich (D) 74.06% Jon Heben (R) 23.80% Judy Locy (I) 2.14% |
Ohio 11 | Stephanie Tubbs Jones | Democratic | 1998 | Re-elected | Stephanie Tubbs Jones (D) 76.33% Patrick Pappano (R) 23.67% |
Ohio 12 | Pat Tiberi | Republican | 2000 | Re-elected | Pat Tiberi (R) 64.39% Edward S. Brown (D) 35.61% |
Ohio 13 | Sherrod Brown | Democratic | 1992 | Re-elected | Sherrod Brown (D) 68.97% Ed Oliveros (R) 31.03% |
Ohio 14 | Steve LaTourette Redistricted from the 19th district (now obsolete) | Republican | 1994 | Re-elected | Steve LaTourette (R) 72.12% Dale Virgil Blanchard (D) 27.82% |
Ohio 15 | Deborah Pryce | Republican | 1992 | Re-elected | Deborah Pryce (R) 66.59% Mark P. Brown (D) 33.41% |
Ohio 16 | Ralph Regula | Republican | 1972 | Re-elected | Ralph Regula (R) 68.87% Jim Rice (D) 31.13% |
Ohio 17 | Vacant | Democratic gain | Timothy Ryan (D) 51.14% Ann Benjamin (R) 33.67% James Traficant (I) 15.19% | ||
Thomas C. Sawyer Redistricted from the 14th district | Democratic | 1986 | Lost redistricting contest Democratic loss | ||
Ohio 18 | Bob Ney | Republican | 1994 | Re-elected | Bob Ney (R) unopposed |
Oklahoma
The state lost one seat in reapportionment.
| District | Incumbent | Party | First elected | Result | Candidates |
|---|---|---|---|---|---|
Oklahoma 1 | John Sullivan | Republican | 1992 | Re-elected | John Sullivan (R) 55.62% Doug Dodd (D) 42.17% Joe Cristiano (I) 2.21% |
Oklahoma 2 | Brad Carson | Democratic | 2000 | Re-elected | Brad Carson (D) 74.12% Kent Pharaoh (R) 25.88% |
Oklahoma 3 | Wes Watkins | Republican | 1976 | Retired Republican loss | Frank Lucas (R) 75.58% Robert T. Murphy (D) 24.42% |
Frank Lucas Redistricted from the 6th district (now obsolete) | Republican | 1994 | Re-elected | ||
Oklahoma 4 | J. C. Watts | Republican | 1994 | Retired Republican hold | Tom Cole (R) 53.83% Darryl Roberts (D) 46.17% |
Oklahoma 5 | Ernest Istook | Republican | 1992 | Re-elected | Ernest Istook (R) 62.23% Lou Barlow (D) 32.41% Donna C. Davis (I) 5.37% |
Oregon
| District | Incumbent | Party | First elected | Result | Candidates |
|---|---|---|---|---|---|
Oregon 1 | David Wu | Democratic | 1998 | Re-elected | David Wu (D) 62.69% Jim Greenfield (R) 33.99% Beth A. King (L) 3.21% |
Oregon 2 | Greg Walden | Republican | 1998 | Re-elected | Greg Walden (R) 71.86% Peter Buckley (D) 25.76% Mike Wood (L) 2.25% |
Oregon 3 | Earl Blumenauer | Democratic | 1996 | Re-elected | Earl Blumenauer (D) 66.75% Sarah Seale (R) 26.73% Walt Brown (S) 2.80% Kevin Jones (L) 2.00% David Brownlow (C) 2.49% |
Oregon 4 | Peter DeFazio | Democratic | 1986 | Re-elected | Peter DeFazio (D) 63.82% Liz VanLeeuwen (R) 34.36% Chris Bigelow (L) 1.75% |
Oregon 5 | Darlene Hooley | Democratic | 1996 | Re-elected | Darlene Hooley (D) 54.75% Brian Boquist (R) 45.10% |
Pennsylvania
The state lost two seats in reapportionment.
| District | Incumbent | Party | First elected | Result | Candidates |
|---|---|---|---|---|---|
Pennsylvania 1 | Bob Brady | Democratic | 1998 | Re-elected | Bob Brady (D) 86.43% Marie Delany (R) 12.45% Mike Ewall (G) 1.12% |
Pennsylvania 2 | Chaka Fattah | Democratic | 1994 | Re-elected | Chaka Fattah (D) 87.77% Thomas Dougherty (R) 12.23% |
Pennsylvania 3 | Phil English Redistricted from the 21st district (now obsolete) | Republican | 1994 | Re-elected | Phil English (R) 77.67% AnnDrea Benson (G) 22.32% |
Pennsylvania 4 | Melissa Hart | Republican | 2000 | Re-elected | Melissa Hart (R) 64.55% Stevan Drobac (D) 35.44% |
Pennsylvania 5 | John E. Peterson | Republican | 1996 | Re-elected | John E. Peterson (R) 87.24% Thomas A. Martin (L) 12.62% |
Pennsylvania 6 | None (District created) | New seat Republican gain | Jim Gerlach (R) 51.36% Dan Wofford (D) 48.63% | ||
Pennsylvania 7 | Curt Weldon | Republican | 1986 | Re-elected | Curt Weldon (R) 66.09% Peter Lennon (D) 33.91% |
Pennsylvania 8 | Jim Greenwood | Republican | 1992 | Re-elected | Jim Greenwood (R) 62.58% Timothy Reece (D) 37.40% |
Pennsylvania 9 | Bill Shuster | Republican | 2001 | Re-elected | Bill Shuster (R) 71.02% John R. Henry (D) 28.92% |
Pennsylvania 10 | Don Sherwood | Republican | 1998 | Re-elected | Don Sherwood (R) 92.60% Kurt Shotko (G) 7.07% |
Pennsylvania 11 | Paul Kanjorski | Democratic | 1984 | Re-elected | Paul Kanjorski (D) 55.60% Louis Barletta (R) 42.43% Thomas J. McLaughlin (REF) 1.96% |
Pennsylvania 12 | Frank Mascara Redistricted from the 20th district (now obsolete) | Democratic | 1994 | Lost redistricting contest Democratic loss | John Murtha (D) 73.48% Bill Choby (R) 26.52% |
John Murtha | Democratic | 1974 | Re-elected | ||
Pennsylvania 13 | Robert Borski Redistricted from the 3rd district | Democratic | 1982 | Retired Democratic loss | Joe Hoeffel (D) 50.95% Melissa Brown (R) 47.34% John P. McDermott (CST) 1.71% |
Joe Hoeffel | Democratic | 1998 | Re-elected | ||
Pennsylvania 14 | William J. Coyne | Democratic | 1980 | Retired Democratic loss | Mike Doyle (D) unopposed |
Mike Doyle Redistricted from the 18th district | Democratic | 1994 | Re-elected | ||
Pennsylvania 15 | Pat Toomey | Republican | 1998 | Re-elected | Pat Toomey (R) 57.36% Ed O'Brien (D) 42.64% |
Pennsylvania 16 | Joe Pitts | Republican | 1996 | Re-elected | Joe Pitts (R) 88.45% Will Todd (G) 6.48% Kenneth Brenneman (CST) 5.03% |
Pennsylvania 17 | Tim Holden Redistricted from the 6th district | Democratic | 1992 | Re-elected | Tim Holden (D) 51.41% George Gekas (R) 48.59% |
George Gekas | Republican | 1982 | Lost redistricting contest Republican loss | ||
Pennsylvania 18 | None (District created) | New seat Republican gain | Tim Murphy (R) 60.14% Jack Machek (D) 39.86% | ||
Pennsylvania 19 | Todd Platts | Republican | 2000 | Re-elected | Todd Platts (R) 91.06% Will Todd (G) 5.03% Kenneth Brenneman (L) 3.82% |
Rhode Island
| District | Incumbent | Party | First elected | Result | Candidates |
|---|---|---|---|---|---|
Rhode Island 1 | Patrick Kennedy | Democratic | 1994 | Re-elected | Patrick Kennedy (D) 59.88% David W. Rogers (R) 37.31% Frank Carter (L) 2.71% |
Rhode Island 2 | James Langevin | Democratic | 1996 | Re-elected | James Langevin (D) 76.29% John Matson (R) 22.27% Dorman Hayes (HP) 1.37% |
South Carolina
| District | Incumbent | Party | First elected | Result | Candidates |
|---|---|---|---|---|---|
South Carolina 1 | Henry Brown | Republican | 2000 | Re-elected | Henry Brown (R) 89.56% James E. Dunn (UC) 6.91% Joe Innella (NL) 3.49% |
South Carolina 2 | Joe Wilson | Republican | 2001 | Re-elected | Joe Wilson (R) 84.12% Mark Whittington (UC) 10.03% Jim Legg (L) 5.63% |
South Carolina 3 | Lindsey Graham | Republican | 1994 | Retired to run for U.S. Senate Republican hold | Gresham Barrett (R) 67.14% George Brightharp (D) 31.28% Mike Boerste (L) 1.56% |
South Carolina 4 | Jim DeMint | Republican | 1998 | Re-elected | Jim DeMint (R) 69.00% Peter Ashy (D) 29.67% Faye Walters (NL) 1.23% |
South Carolina 5 | John Spratt | Democratic | 1982 | Re-elected | John Spratt (D) 85.87% Doug Kendall (L) 7.76% Steve Lefemine (C) 6.29% |
South Carolina 6 | Jim Clyburn | Democratic | 1992 | Re-elected | Jim Clyburn (D) 66.98% Gary McLeod (R) 32.03% Craig Augenstein (L) 0.96% |
South Dakota
| District | Incumbent | Party | First elected | Result | Candidates |
|---|---|---|---|---|---|
South Dakota At-large | John Thune | Republican | 1996 | Retired to run for U.S. Senate Republican hold | William Janklow (R) 53.45% Stephanie Herseth (D) 45.62% Terry Begay (L) 0.93% |
Tennessee
| District | Incumbent | Party | First elected | Result | Candidates |
|---|---|---|---|---|---|
Tennessee 1 | William L. Jenkins | Republican | 1996 | Re-elected | William L. Jenkins (R) unopposed |
Tennessee 2 | Jimmy Duncan Jr. | Republican | 1988 | Re-elected | Jimmy Duncan Jr. (R) 78.98% John Greene (D) 19.91% Joshua Williamson (I) 0.60% George Njezic (I) 0.51% |
Tennessee 3 | Zach Wamp | Republican | 1994 | Re-elected | Zach Wamp (R) 64.54% John Wolfe, Jr. (D) 33.82% William Bolen (I) 1.00% Timothy Sevier (I) 0.54% |
Tennessee 4 | Van Hilleary | Republican | 1994 | Retired to run for Governor Democratic gain | Lincoln Davis (D) 52.08% Janice Bowling (R) 46.49% William Chandler (I) 0.58% John Ray (I) 0.33% Bert Mason (I) 0.27% Ed Wellmann (I) 0.22% |
Tennessee 5 | Bob Clement | Democratic | 1988 | Retired to run for U.S. Senate Democratic hold | Jim Cooper (D) 63.73% Robert Duvall (R) 33.25% John Jay Hooker (I) 1.79% Jonathan Farley (I) 0.71% Jesse Turner (I) 0.51% |
Tennessee 6 | Bart Gordon | Democratic | 1984 | Re-elected | Bart Gordon (D) 65.92% Robert Garrison (R) 32.33% Patrick Lyons (I) 1.73% |
Tennessee 7 | Ed Bryant | Republican | 1994 | Retired to run for U.S. Senate Republican hold | Marsha Blackburn (R) 70.73% Tim Barron (D) 26.48% Rick Patterson (I) 2.77% |
Tennessee 8 | John Tanner | Democratic | 1988 | Re-elected | John Tanner (D) 70.14% Mat McClain (R) 27.30% James L. Hart (I) 2.55% |
Tennessee 9 | Harold Ford Jr. | Democratic | 1996 | Re-elected | Harold Ford Jr. (D) 70.14% Tony Rush (I) 16.09% |
Texas
The state gained two seats in reapportionment.
| District | Incumbent | Party | First elected | Result | Candidates |
|---|---|---|---|---|---|
Texas 1 | Max Sandlin | Democratic | 1996 | Re-elected | Max Sandlin (D) 56.45% John Lawrence (R) 43.55% |
Texas 2 | Jim Turner | Democratic | 1996 | Re-elected | Jim Turner (D) 60.85% Van Brookshire (R) 38.19% Peter Beach (L) 0.96% |
Texas 3 | Sam Johnson | Republican | 1991 | Re-elected | Sam Johnson (R) 73.95% Manny Molera (D) 24.33% John E. Davis (L) 1.72% |
Texas 4 | Ralph Hall | Democratic | 1980 | Re-elected | Ralph Hall (D) 57.82% John Graves (R) 40.37% Barbara Robinson (L) 1.81% |
Texas 5 | None (District created) | New seat Republican gain | Jeb Hensarling (R) 58.21% Ron Chapman (D) 40.26% Dan Michalski (L) 0.92% Thomas Kemper (G) 0.61% | ||
Texas 6 | Joe Barton | Republican | 1984 | Re-elected | Joe Barton (R) 70.35% Felix Alvarado (D) 27.68% Frank Brady (L) 1.21% B.J. Armstrong (G) 0.76% |
Texas 7 | John Culberson | Republican | 2000 | Re-elected | John Culberson (R) 89.19% Drew Parks (L) 10.76% |
Texas 8 | Kevin Brady | Republican | 1996 | Re-elected | Kevin Brady (R) 93.14% Gil Guillory (L) 6.86% |
Texas 9 | Nick Lampson | Democratic | 1996 | Re-elected | Nick Lampson (D) 58.60% Paul Williams (R) 40.31% Dean Tucker (L) 1.09% |
Texas 10 | Lloyd Doggett | Democratic | 1994 | Re-elected | Lloyd Doggett (D) 84.37% Michele Messina (L) 15.63% |
Texas 11 | Chet Edwards | Democratic | 1990 | Re-elected | Chet Edwards (D) 51.55% Ramsey Farley (R) 47.11% Andrew Paul Farris (L) 1.34% |
Texas 12 | Kay Granger | Republican | 1996 | Re-elected | Kay Granger (R) 91.87% Edward A. Hanson (D) 8.13% |
Texas 13 | Mac Thornberry | Republican | 1994 | Re-elected | Mac Thornberry (R) 79.27% Zane Reese (D) 20.73% |
Texas 14 | Ron Paul | Republican | 1996 | Re-elected | Ron Paul (R) 68.09% Corby Windham (D) 31.91% |
Texas 15 | Ruben Hinojosa | Democratic | 1996 | Re-elected | Ruben Hinojosa (D) unopposed |
Texas 16 | Silvestre Reyes | Democratic | 1996 | Re-elected | Silvestre Reyes (D) unopposed |
Texas 17 | Charles Stenholm | Democratic | 1978 | Re-elected | Charles Stenholm (D) 51.36% Rob Beckham (R) 47.39% Fred Jones (L) 1.25% |
Texas 18 | Sheila Jackson Lee | Democratic | 1994 | Re-elected | Sheila Jackson Lee (D) 76.91% Phillip Abbott (R) 21.70% Brent Sullivan (L) 1.38% |
Texas 19 | Larry Combest | Republican | 1984 | Re-elected | Larry Combest (R) 91.64% Larry Johnson (L) 8.36% |
Texas 20 | Charlie Gonzalez | Democratic | 1998 | Re-elected | Charlie Gonzalez (D) unopposed |
Texas 21 | Lamar S. Smith | Republican | 1986 | Re-elected | Lamar S. Smith (R) 72.87% John Courage (D) 25.31% D.G. Roberts (L) 1.82% |
Texas 22 | Tom DeLay | Republican | 1984 | Re-elected | Tom DeLay (R) 63.17% Tim Riley (D) 35.02% Jerry LaFleur (L) 1.01% Joel West (G) 0.79% |
Texas 23 | Henry Bonilla | Republican | 1992 | Re-elected | Henry Bonilla (R) 51.53% Henry Cuellar (D) 47.20% Jeffrey Blunt (L) 0.73% Ed Scharf (G) 0.54% |
Texas 24 | Martin Frost | Democratic | 1978 | Re-elected | Martin Frost (D) 64.66% Mike Rivera Ortega (R) 33.95% Ken Ashby (L) 1.38% |
Texas 25 | Ken Bentsen | Democratic | 1994 | Retired to run for U.S. Senate Democratic hold | Chris Bell (D) 54.76% Tom Reiser (R) 43.09% George Reiter (G) 1.20% Guy McLendon (L) 0.94% |
Texas 26 | Dick Armey | Republican | 1984 | Retired Republican hold | Michael Burgess (R) 74.81% Paul LeBon (D) 22.76% David Croft (L) 1.44% Gary R. Page (G) 0.99% |
Texas 27 | Solomon Ortiz | Democratic | 1982 | Re-elected | Solomon Ortiz (D) 61.10% Pat Ahumada (R) 36.54% Christopher Claytor (L) 2.36% |
Texas 28 | Ciro Rodriguez | Democratic | 1997 | Re-elected | Ciro Rodriguez (D) 71.09% Gabriel Perales (R) 26.86% William Stallknecht (I) 2.05% |
Texas 29 | Gene Green | Democratic | 1992 | Re-elected | Gene Green (D) 95.16% Joe Vu (L) 4.84% |
Texas 30 | Eddie Bernice Johnson | Democratic | 1992 | Re-elected | Eddie Bernice Johnson (D) 74.26% Ron Bush (R) 24.19% Lance Flores (L) 1.55% |
Texas 31 | None (District created) | New seat Republican gain | John Carter (R) 69.08% David Bagley (D) 27.36% Clark Simmons (L) 1.26% John S. Petersen (G) 1.23% R.C. Crawford (I) 1.06% | ||
Texas 32 | Pete Sessions Redistricted from the 5th district | Republican | 1996 | Re-elected | Pete Sessions (R) 67.77% Pauline Dixon (D) 30.35% Steve Martin (L) 1.07% Carla Hubbell (G) 0.82% |
Utah
| District | Incumbent | Party | First elected | Result | Candidates |
|---|---|---|---|---|---|
Utah 1st | James V. Hansen | Republican | 1980 | Retired Republican hold | Rob Bishop (R) 60.69% Dave Thomas (D) 36.84% Craig Axford (G) 2.24% |
Utah 2nd | Jim Matheson | Democratic | 2000 | Re-elected | Jim Matheson (D) 49.43% John Swallow (R) 48.69% Patrick Diehl (G) 1.16% Ron Copier (L) 0.72% |
Utah 3rd | Chris Cannon | Republican | 1996 | Re-elected | Chris Cannon (R) 67.43% Matt Throckmorton (D) 28.98% Kitty Burton (L) 3.59% |
Vermont
| District | Incumbent | Party | First elected | Result | Candidates |
|---|---|---|---|---|---|
Vermont At-large | Bernie Sanders | Independent | 1990 | Re-elected | Bernie Sanders (I) 64.26% Bill Meub (R) 32.29% Jane Newton (P/LU) 1.41% Fawn Skinner (VG) 1.04% Daniel Krymkowski (L) 0.90% |
Virginia
| District | Incumbent | Party | First elected | Result | Candidates |
|---|---|---|---|---|---|
Virginia 1 | Jo Ann Davis | Republican | 2000 | Re-elected | Jo Ann Davis (R) unopposed |
Virginia 2 | Ed Schrock | Republican | 2000 | Re-elected | Ed Schrock (R) 83.15% D.C. Amarasinghe (G) 16.49% |
Virginia 3 | Bobby Scott | Democratic | 1992 | Re-elected | Bobby Scott (D) unopposed |
Virginia 4 | Randy Forbes | Republican | 2001 | Re-elected | Randy Forbes (R) unopposed |
Virginia 5 | Virgil Goode | Independent | 1996 | Re-elected as a Republican Republican gain | Virgil Goode (R) 63.48% Meredith Richards (D) 36.48% |
Virginia 6 | Bob Goodlatte | Republican | 1992 | Re-elected | Bob Goodlatte (R) unopposed |
Virginia 7 | Eric Cantor | Republican | 2000 | Re-elected | Eric Cantor (R) 69.45% Ben Jones (D) 30.46% |
Virginia 8 | Jim Moran | Democratic | 1990 | Re-elected | Jim Moran (D) 59.81% Scott Tate (R) 37.32% Ronald Crickenberger (I) 2.65% |
Virginia 9 | Rick Boucher | Democratic | 1982 | Re-elected | Rick Boucher (D) 65.76% Jay Katzen (R) 34.22% |
Virginia 10 | Frank Wolf | Republican | 1980 | Re-elected | Frank Wolf (R) 71.72% John B. Stevens, Jr. (D) 28.13% |
Virginia 11 | Tom Davis | Republican | 1994 | Re-elected | Tom Davis (R) 82.90% Frank Creel (C) 16.47% |
Washington
| District | Incumbent | Party | First elected | Result | Candidates |
|---|---|---|---|---|---|
Washington 1 | Jay Inslee | Democratic | 1998 | Re-elected | Jay Inslee (D) 55.64% Joe Marine (R) 41.31% Mark B. Wilson (L) 3.05% |
Washington 2 | Rick Larsen | Democratic | 2000 | Re-elected | Rick Larsen (D) 50.77% Norma Smith (R) 45.77% Bruce Guthrie (L) 2.14% Bern Haggerty (G) 2.02% |
Washington 3 | Brian Baird | Democratic | 1998 | Re-elected | Brian Baird (D) 61.69% Joseph Zarelli (R) 38.31% |
Washington 4 | Doc Hastings | Republican | 1994 | Re-elected | Doc Hastings (R) 66.90% Craig Mason (D) 33.10% |
Washington 5 | George Nethercutt | Republican | 1994 | Re-elected | George Nethercutt (R) 62.66% Bart Haggin (D) 32.21% Rob Chase (L) 5.13% |
Washington 6 | Norm Dicks | Democratic | 1976 | Re-elected | Norm Dicks (D) 64.20% Bob Lawrence (R) 31.35% John A. Bennett (L) 4.45% |
Washington 7 | Jim McDermott | Democratic | 1988 | Re-elected | Jim McDermott (D) 74.07% Carol Thorne Cassady (R) 21.92% Stan Lippmann (L) 4.00% |
Washington 8 | Jennifer Dunn | Republican | 1992 | Re-elected | Jennifer Dunn (R) 59.82% Heidi Behrens-Benedict (D) 37.34% Mark Taff (L) 2.84% |
Washington 9 | Adam Smith | Democratic | 1996 | Re-elected | Adam Smith (D) 58.52% Sarah Casada (R) 38.57% J. Mills (L) 2.91% |
West Virginia
| District | Incumbent | Party | First elected | Result | Candidates |
|---|---|---|---|---|---|
West Virginia 1 | Alan Mollohan | Democratic | 1982 | Re-elected | Alan Mollohan (D) unopposed |
West Virginia 2 | Shelley Moore Capito | Republican | 2000 | Re-elected | Shelley Moore Capito (R) 60.04% Jim Humphreys (D) 39.96% |
West Virginia 3 | Nick Rahall | Democratic | 1976 | Re-elected | Nick Rahall (D) 70.22% Paul Chapman (R) 29.78% |
Wisconsin
The state lost one seat in reapportionment.
| District | Incumbent | Party | First elected | Result | Candidates |
|---|---|---|---|---|---|
Wisconsin 1 | Paul Ryan | Republican | 1998 | Re-elected | Paul Ryan (R) 67.19% Jeffrey C. Thomas (D) 30.63% George Meyers (L) 2.11% |
Wisconsin 2 | Tammy Baldwin | Democratic | 1998 | Re-elected | Tammy Baldwin (D) 66.01% Ron Greer (R) 33.83% |
Wisconsin 3 | Ron Kind | Democratic | 1996 | Re-elected | Ron Kind (D) 62.82% Bill Arndt (R) 33.54% George Meyers (L) 3.20% |
Wisconsin 4 | Jerry Kleczka | Democratic | 1984 | Re-elected | Jerry Kleczka (D) 86.32% Brian Verdin (G) 12.96% |
Tom Barrett Redistricted from the 5th district | Democratic | 1992 | Retired to run for Governor Democratic loss | ||
Wisconsin 5 | James Sensenbrenner Redistricted from the 9th district (now obsolete) | Republican | 1978 | Re-elected | James Sensenbrenner (R) 86.13% Robert R. Raymond (I) 13.32% |
Wisconsin 6 | Tom Petri | Republican | 1979 | Re-elected | Tom Petri (R) unopposed |
Wisconsin 7 | Dave Obey | Democratic | 1969 | Re-elected | Dave Obey (D) 64.21% Joe Rothbauer (R) 35.76% |
Wisconsin 8 | Mark Green | Republican | 1998 | Re-elected | Mark Green (R) 72.58% Andrew Becker (D) 23.89% Dick Kaiser (G) 3.49% |
Wyoming
| District | Incumbent | Party | First elected | Result | Candidates |
|---|---|---|---|---|---|
Wyoming At-large | Barbara Cubin | Republican | 1994 | Re-elected | Barbara Cubin (R) 60.51% Ron Akin (D) 36.21% Lewis Stock (L) 3.27% |
See also
United States elections, 2002
- United States gubernatorial elections, 2002
- United States Senate elections, 2002
- 107th United States Congress
- 108th United States Congress
References
^ https://www.smithsonianmag.com/history/top-10-historic-midterm-elections-65355118/
^ "Our Campaigns - Container Detail Page". www.ourcampaigns.com. Retrieved December 20, 2017..mw-parser-output cite.citation{font-style:inherit}.mw-parser-output q{quotes:"""""""'""'"}.mw-parser-output code.cs1-code{color:inherit;background:inherit;border:inherit;padding:inherit}.mw-parser-output .cs1-lock-free a{background:url("//upload.wikimedia.org/wikipedia/commons/thumb/6/65/Lock-green.svg/9px-Lock-green.svg.png")no-repeat;background-position:right .1em center}.mw-parser-output .cs1-lock-limited a,.mw-parser-output .cs1-lock-registration a{background:url("//upload.wikimedia.org/wikipedia/commons/thumb/d/d6/Lock-gray-alt-2.svg/9px-Lock-gray-alt-2.svg.png")no-repeat;background-position:right .1em center}.mw-parser-output .cs1-lock-subscription a{background:url("//upload.wikimedia.org/wikipedia/commons/thumb/a/aa/Lock-red-alt-2.svg/9px-Lock-red-alt-2.svg.png")no-repeat;background-position:right .1em center}.mw-parser-output .cs1-subscription,.mw-parser-output .cs1-registration{color:#555}.mw-parser-output .cs1-subscription span,.mw-parser-output .cs1-registration span{border-bottom:1px dotted;cursor:help}.mw-parser-output .cs1-hidden-error{display:none;font-size:100%}.mw-parser-output .cs1-visible-error{font-size:100%}.mw-parser-output .cs1-subscription,.mw-parser-output .cs1-registration,.mw-parser-output .cs1-format{font-size:95%}.mw-parser-output .cs1-kern-left,.mw-parser-output .cs1-kern-wl-left{padding-left:0.2em}.mw-parser-output .cs1-kern-right,.mw-parser-output .cs1-kern-wl-right{padding-right:0.2em}
^ "Our Campaigns - Container Detail Page". www.ourcampaigns.com. Retrieved December 20, 2017.
^ Representatives, Office of the Clerk, U.S. House of. "Office of the Clerk of the U.S. House of Representatives". clerk.house.gov. Retrieved 20 December 2017.
External links
United States Election 2002 Web Archive from the U.S. Library of Congress


