Cumbernauld and Kilsyth (Scottish Parliament constituency)
| Cumbernauld and Kilsyth | |
|---|---|
county constituency for the Scottish Parliament | |
 | |
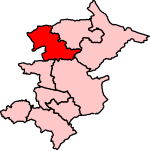
 Cumbernauld and Kilsyth shown within the Central Scotland electoral region and the region shown within Scotland | |
| Current constituency | |
| Created | 2011 |
| Party | Scottish National Party |
| MSP | Jamie Hepburn |
| Council area | North Lanarkshire |
Cumbernauld and Kilsyth is a constituency of the Scottish Parliament (Holyrood). It elects one Member of the Scottish Parliament (MSP) by the plurality (first past the post) method of election. Also, however, it is one of nine constituencies in the Central Scotland electoral region, which elects seven additional members, in addition to nine constituency MSPs, to produce a form of proportional representation for the region as a whole.
Contents
1 Electoral region
2 Constituency boundaries and council area
3 Member of the Scottish Parliament
4 Election results
5 Footnotes
Electoral region
The other eight constituencies of the Central Scotland Scottish Parliament region are Airdrie and Shotts, Coatbridge and Chryston, East Kilbride, Falkirk East, Falkirk West, Hamilton, Larkhall and Stonehouse, Motherwell and Wishaw and Uddingston and Bellshill.
The region covers all of the Falkirk council area, all of the North Lanarkshire council area and part of the South Lanarkshire council area.
Constituency boundaries and council area
The constituency was created at the same time as the Scottish Parliament, in 1999, with the name and boundaries of an existing Westminster constituency. In 2005, however, Scottish Westminster (House of Commons) constituencies were mostly replaced with new constituencies.[1]
The Holyrood constituency is one of four covering the North Lanarkshire council area, the others being Airdrie and Shotts, Coatbridge and Chryston, Motherwell and Wishaw and Uddingston and Bellshill. All four are within the Central Scotland electoral region.
The electoral wards used in the creation of Cumbernauld and Kilsyth are:
- In full: Kilsyth, Cumbernauld North, Cumbernauld East and Cumbernauld South.
Member of the Scottish Parliament
| Election | Member | Party | |
|---|---|---|---|
1999 | Cathie Craigie | Scottish Labour Party | |
2011 | Jamie Hepburn | Scottish National Party | |
Election results
| Party | Candidate | Votes | % | ± | |
|---|---|---|---|---|---|
SNP | Jamie Hepburn | 17,015 | 60.1 | +6.3 | |
Labour | Mark Griffin | 7,537 | 26.6 | -13.5 | |
Conservative | Anthony Newman | 3,068 | 10.8 | +6.3 | |
Liberal Democrats | Irene Lang | 688 | 2.4 | +0.9 | |
| Majority | 9,478 | 33.5 | +19.8 | ||
Turnout | 28,308 | 56.7 | +4.8 | ||
SNP hold | Swing | +9.9 | |||
| Party | Candidate | Votes | % | ± | |
|---|---|---|---|---|---|
SNP | Jamie Hepburn | 13,595 | 53.8 | +13.7 | |
Labour | Cathie Craigie | 10,136 | 40.1 | -7.9 | |
Conservative | James Boswell | 1,156 | 4.6 | -0.9 | |
Liberal Democrats | Martin Oliver | 367 | 1.5 | -4.9 | |
| Majority | 3,459 | 13.7 | |||
Turnout | 25,254 | 51.9 | -4.3% | ||
SNP gain from Labour | Swing | +10.8 | |||
| Party | Candidate | Votes | % | ± | |
|---|---|---|---|---|---|
Labour | Cathie Craigie | 12,672 | 48.0 | +6.4 | |
SNP | Jamie Hepburn | 10,593 | 40.2 | +0.8 | |
Liberal Democrats | Hugh O'Donnell | 1,670 | 6.3 | +1.1 | |
Conservative | Anne Harding | 1,447 | 5.5 | +1.5 | |
| Majority | 2,079 | 7.9 | |||
| Rejected ballots | 803 | ||||
Turnout | 26,382 | 53.6 | +3.5 | ||
Labour hold | Swing | -2.8 | |||
| Party | Candidate | Votes | % | ± | |
|---|---|---|---|---|---|
Labour | Cathie Craigie | 10,146 | 41.58 | -8.01 | |
SNP | Andrew Wilson | 9,626 | 39.44 | +3.76 | |
Scottish Socialist | Kenny McEwan | 1,823 | 7.47 | +3.82 | |
Liberal Democrats | Hugh O'Donnell | 1,264 | 5.18 | -1.12 | |
Conservative | Margaret McCulloch | 978 | 4.01 | -0.44 | |
Independent | Christopher Donohue | 567 | 2.32 | +2.32 | |
| Majority | 520 | 2.13 | -11.78 | ||
Turnout | 24,404 | 50.14 | -11.83 | ||
Labour hold | Swing | ||||
| Party | Candidate | Votes | % | ± | |
|---|---|---|---|---|---|
Labour | Cathie Craigie | 15,182 | 49.6 | N/A | |
SNP | Andrew Wilson | 10,923 | 35.7 | N/A | |
Liberal Democrats | Hugh O'Donnell | 2,029 | 6.63 | N/A | |
Conservative | Robin Slack | 1,362 | 4.5 | N/A | |
Scottish Socialist | Kenny McEwan | 1,116 | 3.65 | N/A | |
| Majority | 4,259 | 13.9 | N/A | ||
Turnout | 30,612 | N/A | |||
Labour win (new seat) | |||||
Footnotes
^ See The 5th Periodical Report of the Boundary Commission for Scotland Archived September 21, 2007, at the Wayback Machine.