1991 New South Wales state election
| ||||||||||||||||||||||||||||||||||
All 99 seats in the New South Wales Legislative Assembly and 21 (of the 42) seats in the New South Wales Legislative Council 50 Assembly seats were needed for a majority | ||||||||||||||||||||||||||||||||||
|---|---|---|---|---|---|---|---|---|---|---|---|---|---|---|---|---|---|---|---|---|---|---|---|---|---|---|---|---|---|---|---|---|---|---|
| ||||||||||||||||||||||||||||||||||
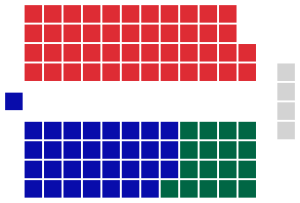 Legislative Assembly after the election | ||||||||||||||||||||||||||||||||||
| ||||||||||||||||||||||||||||||||||

Elections to the 50th Parliament of New South Wales were held on Saturday 25 May 1991. All seats in the Legislative Assembly and half the seats in the Legislative Council were up for election. The Liberal-National Coalition government of Premier Nick Greiner, which enjoyed a considerable majority following their landslide win at the 1988 election, was seeking a second term in office against new Labor Opposition Leader Bob Carr.
The government had reduced the number of lower house seats from 109 to 99 for the 1991 election, reversing an increase approved by the Unsworth Labor government.
Contents
1 Background
1.1 Greiner Government
1.2 Labor Opposition
1.3 Economic conditions
2 Redistribution
3 Campaign
4 Key dates
5 Results
5.1 Legislative Assembly
5.2 Legislative Council
6 Seats changing hands
6.1 Redistribution affected seats
7 Post-election pendulum
8 Aftermath
9 See also
10 Notes
11 References
Background
Greiner Government
The 1988 election generated a two-party preferred swing to the Coalition of 8.4% and saw the Labor Party record its lowest primary vote in half a century. This was a clear rejection of the Unsworth Government, although it was less clear whether the electorate was endorsing the full range of Coalition policies. Qualms about the meaning of its mandate were clearly of little concern to the new government under Nick Greiner which immediately began introducing wide ranging reforms to the New South Wales public sector.
The finance and administration of all government trading enterprises was put on a more commercial basis, with standard rates of return on capital set and separate community service obligations for specific public funding identified. There were major expenditure cuts and dramatic price increases in education, public transport and electricity. The new government spoke of New South Wales living beyond its means, introducing new user-pay charges, proposed the sale of underused public assets to help pay off state debt and flagged the use of private capital to build public infrastructure. It was a radical agenda at the time, but a package of reforms that would become standard across Australia over the next decade.
The government implemented “truth in sentencing” laws which required judges to set minimum terms for convicted criminals and abolished time off for good behaviour in gaol. Responding to the corruption allegations that had regularly swirled around New South Wales politics, the government also created a standing royal commission, the Independent Commission Against Corruption (ICAC), as an independent body to investigate allegations of corruption and maladministration.
The government attracted most controversy over changes to education and the confrontational style of Education Minister Terry Metherell. There were major cutbacks in teaching and ancillary staff, closures of schools and an increase in class sizes and the number of composite classes. The government unzoned state schools, allowing parents to enrol their children outside of the local district, and allowed the creation of new selective and specialist high schools.
Labor Opposition
The Labor Opposition initially struggled in the face of the government’s rapidly moving agenda. Ten ministers had either retired or been defeated at the 1988 election. The former Environment and Planning Minister, Bob Carr had reluctantly accepted the party leadership. The Opposition had some encouraging results at by-elections as the government’s new taxes and charges began to bite.
Labor made important gains at the March 1990 federal election, but the electoral position had been reversed by the end of the year.
Economic conditions
The economic recession of the early-1990s hit the State’s finances, but New South Wales was substantially better off than interstate Labor administrations that had accumulated debt and gambled on failed commercial ventures.
The hard medicine introduced by the Greiner Government was unpopular, but it was becoming apparent that New South Wales was in a better position as a result of the financial changes. The surprise resignation of Metherell over tax charges in July 1990 provided a boost for the government by removing its most controversial Minister.
Opinion polls showed the government trailing by seven points in March 1990, but 15 points ahead in December. The government was now well placed for an early election and keen to avoid the opprobrium of another tough budget.
Redistribution
The opportunity came with the finalisation of a redistribution in March 1991. The Coalition had promised to cut the size of the Legislative Assembly from 109 to 99 seats, reversing the previous government’s increase and automatically triggering a redistribution.
Without control of the Legislative Council, the Coalition was unable to alter Labor’s projected enrolment quotas, but did insert a new provision in the Constitution Act so that a redistribution could take place after one term if more than one-quarter of districts differed from the average enrolment by more than 5% for two consecutive months.
The Coalition’s promise to cut the number of MPs was an attempt to overturn what it considered a Labor gerrymander. Other views could explain this as a demonstration of a historically inward looking Liberal members limiting themselves to the Northern Beaches and only as far west as was necessary to form government, as previous Liberal-National governments had only wished to really have more control over projects and reallocation based not on need but pork barreling, with the reallocation of state funds and priority given to sitting government members' electorates from the first budget in 1988.
Despite winning 56.0% of the two-party preferred vote in 1988, the Coalition could have lost its majority with a swing of just 1.3%. The redistribution gamble worked in part, as the swing needed for the government to lose its majority increased to 2.9% on the new boundaries.
With the boundaries finalised, an early election was called for 25 May 1991. The final change to the voting laws prohibiting ticks and crosses on Ballot Papers would see a massive increase in the informal vote. Additionally, a referendum for changes to the Legislative Council was to be held.
Campaign
The government campaigned on its record, arguing good financial management had prevented New South Wales suffering the sort of financial collapse caused by interstate Labor Governments.
The Labor Party campaigned on those same government reforms, but concentrated on how the government’s new taxes and charges had hurt lower to middle income families, combined with the government's sale of state assets and institutions, reduction in services for health, public housing maintenance, transport (particularly rail), tolls on the M4 motorway, and RTA road $2 million funding for Western Sydney Council's being wiped out and used in the Deputy Premier Wal Murray's Western NSW seat of Barwon following the Nyngan floods of 1990. The Nyngan floods additionally damaged the passenger rail line, with the flood damaged rail line never repaired or services reopened. The tendering out to a South African listed company transport and delivery of documents in contravention of the international boycott of business dealings with South African private, listed and government organisations was also an issue.
Disparity in government responses to natural disasters was highlighted by the lack of natural disaster declarations in March 1990. On 18 March 1990, a savage hailstorm devastated regions of areas from southwest Sydney to near Dee Why. Hailstones the size of cricket balls and in some case larger pummeled vehicles and punctured holes in house roofs across many suburbs particularly Liverpool, Bankstown, Bass Hill, Auburn and Lidcombe. Hail sizes reported from this storm were up to 8 cm in diameter. One reliable report from Liverpool used two hands to indicate the sizes of the hail that fell at his residence. The Government failed to make a disaster declaration, however.
Adding insult to injury, the electorates with government members were assisted as a priority with many employees of those whose homes had been damaged in the South West of Sydney being directed to the government members' areas first. The 1990 disaster was until recently one of Australia's most costly natural disasters with a cost in 1990 of AUD$319 million (2011 normalised cost of AUD$1.3 billion). Some homes for over 10 years in the Southwest of Sydney damaged by this weather event had temporary "Tarps" on roofs. Local government infrastructure in the areas damaged by the hailstorm event also had to repair local facilities with existing funds to repair them with the absence of a natural disaster declaration. Local halls, swimming facilities, sporting and recreational areas were repaired without disaster relief funding from the state government, leaving the cost of repairs to local governments.
Key dates
| Date | Event |
|---|---|
| 3 May 1991 | The Legislative Assembly was dissolved, and writs were issued by the Governor to proceed with an election.[1] |
| 8 May 1991 | Nominations for candidates for the election closed at noon. |
| 25 May 1991 | Polling day, between the hours of 8am and 6pm. |
| 6 June 1991 | The Greiner-Murray Ministry was reconstituted. |
| 28 June 1991 | The writ was returned and the results formally declared. |
| 2 July 1991 | Parliament resumed for business. |
Results
The result was a stalemate. Total formal voting for the state was 3,083,260 voters with 3,205,524 formal votes in 1988.
Legislative Assembly
New South Wales state election, 25 May 1991 | ||||||
|---|---|---|---|---|---|---|
| Enrolled voters | 3,631,618 | |||||
| Votes cast | 3,400,092 | Turnout | 93.62% | +0.04% | ||
| Informal votes | 316,832 | Informal | 9.32% | +6.04% | ||
| Summary of votes by party | ||||||
| Party | Primary votes | % | Swing | Seats | Change | |
| | Labor | 1,204,066 | 39.05% | +0.57% | 46 | + 3 |
| | Liberal | 1,053,100 | 34.16% | –1.64% | 32 | – 7 |
| | National | 324,214 | 10.52% | –3.22% | 17 | – 3 |
| | Democrats | 165,229 | 5.36% | +3.55% | 0 | ± 0 |
| | Call to Australia | 36,807 | 1.19% | +0.75% | 0 | ± 0 |
| | Country Residents | 16,557 | 0.54% | +0.54% | 0 | ± 0 |
| | Greens NSW | 16,556 | 0.54% | +0.54% | 0 | ± 0 |
| | CEC | 5,198 | 0.17% | +0.17% | 0 | ± 0 |
| | Other parties | 5,310 | 0.17% | –1.39% | 0 | ± 0 |
| | Independent | 256,223 | 8.31% | +0.14% | 4 | – 3 |
| Total | 3,083,260 | | | 99 | | |
Two-party-preferred | ||||||
| | Liberal/National | 1,539,949 | 52.69% | –3.27% | ||
| | Labor | 1,379,267 | 47.31% | +3.27% | ||
Legislative Council
New South Wales state election, 25 May 1991 | ||||||
|---|---|---|---|---|---|---|
| Enrolled voters | 3,631,618 | |||||
| Votes cast | 3,398,550 | Turnout | 93.58 | +1.66 | ||
| Informal votes | 192,718 | Informal | 5.67 | –2.64 | ||
| Summary of votes by party | ||||||
| Party | Primary votes | % | Swing | Seats won | Seats held | |
| | Liberal/National Coalition | 1,453,441 | 45.34 | –0.81 | 7 | 20 |
| | Labor | 1,195,324 | 37.29 | –0.22 | 6 | 18 |
| | Democrats | 167,245 | 6.70 | +3.97 | 1 | 2 |
| | Call to Australia | 114,648 | 3.58 | –2.16 | 1 | 2 |
| | Greens | 106,325 | 3.32 | +3.32 | 0 | 0 |
| | EFF/Greypower/CEC | 49,077 | 1.53 | –0.87 | 0 | 0 |
| | Country Residents Party | 21,628 | 0.67 | +0.67 | 0 | 0 |
| | No Toxic Incinerator Group | 18,706 | 0.58 | +0.58 | 0 | 0 |
| | Marie Bignold Team | 14,403 | 0.45 | +0.45 | 0 | 0 |
| | Other | 17,598 | 0.54 | * | 0 | 0 |
| Total | 3,205,832 | | | 15 | | |
The 1991 election had the highest informal vote on record of 9.32%. Labor seats had high informal votes with 23.48% in Bankstown, 17.80% in Cabramatta, 15.29% in Canterbury, 19.13% in Fairfield, 16.03% in Heffron, 15.82% in Lakemba, 22.24% in Londonderry, 16.07% in Smithfield and 8.26% in The Entrance. Informal votes was higher than all candidates except the winner of the seat. ABC election analyst Antony Green's election analysis stated it "may well be the highest ever recorded at a democratic election in the world".
The Liberal Party won The Entrance by only 116 votes at the 1991 election. The Labor Party launched a Court of Disputed Returns challenge based on the significant number of voters in the electorate who had incorrectly been issued absent votes for neighbouring Gosford. The Court upheld the appeal and ordered a by-election. During the by-election, the informal vote was only 1.57%.
The referendum for changes to the upper house were approved by 58% of voters.
The Coalition recorded 52.7% of the two-party preferred vote, but most of its margin was wasted on landslide margins in its heartland. Meanwhile, Labor rebounded strongly under Carr, recovering much of the ground it had lost in its severe defeat three years earlier. As a result, the Coalition suffered a 10-seat swing, winning only 49 of the 99 seats, one seat short of a majority. The Coalition also lost control of the Legislative Council at the election.
Labor defeated the four Independents elected to safe Labor seats in 1988, and in addition re-gained Broken Hill, Drummoyne and Port Stephens, seats that on the new boundaries were notionally Coalition held. Former Labor MPs were returned to Parliament in both Cessnock and Bathurst, while the issue of user-pay charges played an important part in Labor gaining both Parramatta and Penrith.
Coming so close to victory was a shock for the Labor Party, having entered the 1991 election merely hoping to hold what it had and regain traditional Labor seats lost to Independents in 1988. The Coalition was overconfident that perceptions of good economic management would see it re-elected. It ran a presidential campaign that won the overall vote but resulted in the loss of key seats. The Coalition’s best results were in safe Liberal Party seats on Sydney’s North Shore while Labor won the battle in marginal seats.
Seats changing hands
| Seat | Pre-1991 | Swing | Post-1991 | ||||||
|---|---|---|---|---|---|---|---|---|---|
| Party | Member | Margin | Margin | Member | Party | ||||
Bathurst | | Liberal | David Berry | 5.2 | -10.3 | 5.1 | Mick Clough | Labor | |
Cessnock | | Liberal | Bob Roberts | 0.4 | -4.8 | 4.4 | Stan Neilly | Labor | |
Manly | | Liberal | David Hay | 14.9 | -15.6 | 0.7 | Peter Macdonald | Independent | |
Newcastle | | Independent | George Keegan | 3.1 | -15.5 | 12.4 | Bryce Gaudry | Labor | |
Penrith | | Liberal | Guy Matheson | 1.2 | -5.8 | 4.6 | Faye Lo Po' | Labor | |
Swansea | | Independent | Ivan Welsh | 8.1 | -14.0 | 6.4 | Don Bowman | Labor | |
Tamworth | | National | Noel Park | 25.1 | -34.9 | 9.8 | Tony Windsor | Independent | |
Wollongong | | Independent | Frank Arkell | 4.7 | -13.3 | 8.6 | Gerry Sullivan | Labor | |
Redistribution affected seats
Seat | 1988 Election | 1990 Redistribution | Swing | 1991 Election | |||||||||
Party | Member | Margin | Party | Member | Margin | Margin | Member | Party | |||||
Bligh | | Independent | Clover Moore | 0.6 | | Liberal | Notional | 4.1 | -10.2 | 6.1 | Clover Moore | Independent | |
Broken Hill | | Labor | Bill Beckroge | 2.0 | | National | Notional | 2.0 | -12.1 | 10.1 | Bill Beckroge | Labor | |
Drummoyne | | Labor | John Murray | 2.1 | | Liberal | Notional | 0.9 | -4.5 | 3.6 | John Murray | Labor | |
North Shore | | Independent | Robyn Read | 2.1§ | | Liberal | Notional | 1.6 | +0.9 | 2.5 | Phillip Smiles | Liberal | |
Parramatta | | Liberal | John Books | 0.5 | | Labor | Notional | 0.3 | +2.3 | 2.6 | Andrew Ziolkowski | Labor | |
Port Stephens | | Labor | Bob Martin | 0.2 | | Liberal | Notional | 2.9 | -13.0 | 10.1 | Bob Martin | Labor | |
§ Margin estimated on Independent member Ted Mack's results against Liberal at the 1988 election.
Post-election pendulum
GOVERNMENT SEATS (53) | |||
Marginal | |||
The Entrance | Bob Graham | LIB | 0.2% |
Maitland | Peter Blackmore | LIB | 0.6% |
Manly | Peter Macdonald | IND | 0.7% v LIB |
Camden | Liz Kernohan | LIB | 1.5% |
North Shore | Phillip Smiles | LIB | 2.5% v IND |
Badgerys Creek | Anne Cohen | LIB | 2.5% |
Blue Mountains | Barry Morris | LIB | 2.6% |
Gladesville | Ivan Petch | LIB | 2.9% |
Sutherland | Chris Downy | LIB | 3.0% |
Murwillumbah | Don Beck | NAT | 3.1% |
Orange | Garry West | NAT | 5.3% v IND |
Fairly safe | |||
Bligh | Clover Moore | IND | 6.1% v LIB |
Southern Highlands | John Fahey | LIB | 6.4% |
Gosford | Chris Hartcher | LIB | 6.7% |
Coffs Harbour | Andrew Fraser | NAT | 7.0% |
Burrinjuck | Alby Schultz | LIB | 8.8% |
Strathfield | Paul Zammit | LIB | 9.3% |
Ermington | Michael Photios | LIB | 9.7% |
Tamworth | Tony Windsor | IND | 9.8% v NAT |
Safe | |||
Miranda | Ron Phillips | LIB | 10.3% |
Clarence | Ian Causley | NAT | 10.6% |
Cronulla | Malcolm Kerr | LIB | 11.3% |
Georges River | Terry Griffiths | LIB | 11.4% |
Oxley | Bruce Jeffery | NAT | 11.5% |
Northern Tablelands | Ray Chappell | NAT | 11.5% |
Murrumbidgee | Adrian Cruickshank | NAT | 11.8% |
Willoughby | Peter Collins | LIB | 11.9% v IND |
Lismore | Bill Rixon | NAT | 12.2% |
Wakehurst | Brad Hazzard | LIB | 12.7% |
Monaro | Peter Cochran | NAT | 12.7% |
Bega | Russell Smith | LIB | 12.8% |
Vaucluse | Michael Yabsley | LIB | 13.0% |
Ballina | Don Page | NAT | 13.3% |
Upper Hunter | George Souris | NAT | 14.7% |
Barwon | Wal Murray | NAT | 15.1% |
Albury | Ian Glachan | LIB | 15.3% |
Wagga Wagga | Joe Schipp | LIB | 15.8% |
Lachlan | Ian Armstrong | NAT | 16.2% |
Dubbo | Gerry Peacocke | NAT | 16.9% |
The Hills | Tony Packard | LIB | 17.4% v IND |
Port Macquarie | Wendy Machin | NAT | 17.7% |
South Coast | John Hatton | IND | 18.3% v LIB |
Myall Lakes | John Turner | NAT | 18.6% |
Eastwood | Andrew Tink | LIB | 18.7% |
Baulkham Hills | Wayne Merton | LIB | 19.7% |
Ku-ring-gai | Nick Greiner | LIB | 22.7% |
Davidson | Terry Metherell | LIB | 22.7% |
Hawkesbury | Kevin Rozzoli | LIB | 22.8% |
Pittwater | Jim Longley | LIB | 23.4% |
Lane Cove | Kerry Chikarovski | LIB | 23.7% |
Northcott | Bruce Baird | LIB | 26.4% |
Murray | Jim Small | NAT | 31.4% |
Gordon | Tim Moore | LIB | 33.5% |
OPPOSITION SEATS (46) | |||
Marginal | |||
Coogee | Ernie Page | ALP | 1.6% |
Parramatta | Andrew Ziolkowski | ALP | 2.6% |
Kogarah | Brian Langton | ALP | 3.3% |
Drummoyne | John Murray | ALP | 3.6% |
Cessnock | Stan Neilly | ALP | 4.4% |
Moorebank | Craig Knowles | ALP | 4.4% |
Hurstville | Morris Iemma | ALP | 4.6% |
Penrith | Faye Lo Po' | ALP | 4.6% |
Bathurst | Mick Clough | ALP | 5.1% |
Fairly safe | |||
Swansea | Don Bowman | ALP | 6.4% v IND |
Canterbury | Kevin Moss | ALP | 6.8% |
Rockdale | George Thompson | ALP | 6.8% |
Smithfield | Carl Scully | ALP | 7.0% |
Riverstone | John Aquilina | ALP | 7.5% |
Blacktown | Pam Allan | ALP | 8.3% |
Wollongong | Gerry Sullivan | ALP | 8.6% v IND |
East Hills | Pat Rogan | ALP | 8.7% |
Wyong | Paul Crittenden | ALP | 9.0% |
Lakemba | Wes Davoren | ALP | 9.4% |
Ashfield | Paul Whelan | ALP | 9.9% |
Campbelltown | Michael Knight | ALP | 9.9% |
Safe | |||
Bankstown | Doug Shedden | ALP | 10.1% |
Broken Hill | Bill Beckroge | ALP | 10.1% |
Port Stephens | Bob Martin | ALP | 10.1% |
Keira | Col Markham | ALP | 10.5% |
Maroubra | Bob Carr | ALP | 10.8% |
Peats | Tony Doyle | ALP | 11.0% |
Fairfield | Geoff Irwin | ALP | 11.3% |
Kiama | Bob Harrison | ALP | 11.4% |
Granville | Kim Yeadon | ALP | 11.9% |
Newcastle | Bryce Gaudry | ALP | 12.4% v IND |
Lake Macquarie | Jeff Hunter | ALP | 12.7% |
Mount Druitt | Richard Amery | ALP | 13.0% |
Charlestown | Richard Face | ALP | 13.1% |
Bulli | Ian McManus | ALP | 13.2% |
Wallsend | John Mills | ALP | 13.2% |
Port Jackson | Sandra Nori | ALP | 13.7% v IND |
Londonderry | Paul Gibson | ALP | 14.0% |
Heffron | Deirdre Grusovin | ALP | 15.7% |
Cabramatta | John Newman | ALP | 16.0% |
St Marys | Tony Aquilina | ALP | 16.4% |
Liverpool | Peter Anderson | ALP | 16.5% |
Auburn | Peter Nagle | ALP | 18.1% |
Illawarra | Terry Rumble | ALP | 19.7% |
Marrickville | Andrew Refshauge | ALP | 19.8% |
Waratah | John Price | ALP | 21.0% |
Aftermath
The balance of power rested with four independents who held seats that would have normally been held by the Coalition. Both John Hatton in South Coast and Clover Moore in Bligh were re-elected. They were joined by former National Party member Tony Windsor in Tamworth and local councillor Dr Peter Macdonald in Manly. Windsor quickly came to an accommodation with the Government, assuring it of another term. However, the three non-aligned Independents, knowing that Greiner was still in a shaky position, used their numbers to negotiate a comprehensive memorandum of understanding. Signed in October 1991, it was a document that concentrated more on issues of accountability and process rather than specific policies.
Most importantly, the agreement introduced fixed four-year parliamentary terms, a provision entrenched in the Constitution with 76% support at a referendum called in conjunction with the 1995 election.
See also
- Candidates of the New South Wales state election, 1991
Notes
^ Parliament of New South Wales. "1991 Election". Retrieved 18 February 2010..mw-parser-output cite.citation{font-style:inherit}.mw-parser-output .citation q{quotes:"""""""'""'"}.mw-parser-output .citation .cs1-lock-free a{background:url("//upload.wikimedia.org/wikipedia/commons/thumb/6/65/Lock-green.svg/9px-Lock-green.svg.png")no-repeat;background-position:right .1em center}.mw-parser-output .citation .cs1-lock-limited a,.mw-parser-output .citation .cs1-lock-registration a{background:url("//upload.wikimedia.org/wikipedia/commons/thumb/d/d6/Lock-gray-alt-2.svg/9px-Lock-gray-alt-2.svg.png")no-repeat;background-position:right .1em center}.mw-parser-output .citation .cs1-lock-subscription a{background:url("//upload.wikimedia.org/wikipedia/commons/thumb/a/aa/Lock-red-alt-2.svg/9px-Lock-red-alt-2.svg.png")no-repeat;background-position:right .1em center}.mw-parser-output .cs1-subscription,.mw-parser-output .cs1-registration{color:#555}.mw-parser-output .cs1-subscription span,.mw-parser-output .cs1-registration span{border-bottom:1px dotted;cursor:help}.mw-parser-output .cs1-ws-icon a{background:url("//upload.wikimedia.org/wikipedia/commons/thumb/4/4c/Wikisource-logo.svg/12px-Wikisource-logo.svg.png")no-repeat;background-position:right .1em center}.mw-parser-output code.cs1-code{color:inherit;background:inherit;border:inherit;padding:inherit}.mw-parser-output .cs1-hidden-error{display:none;font-size:100%}.mw-parser-output .cs1-visible-error{font-size:100%}.mw-parser-output .cs1-maint{display:none;color:#33aa33;margin-left:0.3em}.mw-parser-output .cs1-subscription,.mw-parser-output .cs1-registration,.mw-parser-output .cs1-format{font-size:95%}.mw-parser-output .cs1-kern-left,.mw-parser-output .cs1-kern-wl-left{padding-left:0.2em}.mw-parser-output .cs1-kern-right,.mw-parser-output .cs1-kern-wl-right{padding-right:0.2em}
References
- University of Western Australia Australian Government and Politics Database: 1991 New South Wales Assembly Election
| General elections |
| ||||
|---|---|---|---|---|---|
| Referendums |
| ||||
| Other |
| ||||


